A feasible framework for mutation analysis and reverse transcription polymerase chain reaction (RT-PCR) assay evaluation of COVID-19, including mutation profile visualization, statistics and mutation ratio of each assay. The mutation ratio is conducive to evaluating the coverage of RT-PCR assays in large-sized samples.
devtools::install_github("MSQ-123/CovidMutations")Merge neighboring events of SNP, insertion and deletion.
#The example data:
data("nucmer")

#The input nucmer object can be made by the comment below:
#options(stringsAsFactors = FALSE)
#nucmer<-read.delim("nucmer.snps",as.is=TRUE,skip=4,header=FALSE)
#colnames(nucmer)<-c("rpos","rvar","qvar","qpos","","","","","rlength","qlength","","","rname","qname")
#rownames(nucmer)<-paste0("var",1:nrow(nucmer))

# Fix IUPAC codes
nucmer<-nucmer[!nucmer$qvar%in%c("B","D","H","K","M","N","R","S","V","W","Y"),]
nucmer<- mergeEvents(nucmer = nucmer)## This will update the nucmer objectProvide effects of each SNP, insertion and deletion in virus genome.
data("refseq")
data("gff3")
annot <- setNames(gff3[,10],gff3[,9])  #annot: subset the gene and its product.
outdir <- tempdir()
indelSNP(nucmer = nucmer,
         saveRda = FALSE,
         refseq = refseq,
         gff3 = gff3,
         annot = annot,
outdir = outdir)Plot the mutation statistics after annotating the “nucmer” object by “indelSNP” function.
data("covid_annot")
covid_annot <- as.data.frame(covid_annot)
#outdir <- tempdir()
plotMutAnno(results = covid_annot,figureType = "MostMut", outdir = outdir)Preprocess “nucmer” object to add group information.
data("nucmer")
data("chinalist")
outdir <- tempdir()
nucmerRMD(nucmer = nucmer, outdir = outdir, chinalist = chinalist)Global SNP profiling in virus genome
Note: In order to get a better global SNP profile, the “nucmerr” data is obtained from 150000 mutation sites downsampled from the “nucmer” object(which is for 37527 samples, not for 5465 samples in the “nucmer” example data).
data("nucmerr")
outdir <- tempdir()
globalSNPprofile(nucmerr = nucmerr, outdir = outdir, figure_Type = "heatmap")Plot mutation statistics for nucleiotide.
If the figure type is “TopCountryMut”, “mutpos” can specify a range of genomic position(eg. 28831:28931) for plot.
outdir <- tempdir()
mutStat(nucmerr = nucmerr,
        outdir = ".",
        figure_Type = "TopMuSample",
        type_top = 10,
        country = FALSE,
mutpos = NULL)Calculate the mutation detection rate using different assays
data("assays")
Total <- 11000 ## Total Cleared GISAID fasta data, sekitseq
outdir <- tempdir()
#Output the results
AssayMutRatio(nucmerr = nucmerr,
              assays = assays,
              totalsample = Total,
              plotType = "logtrans",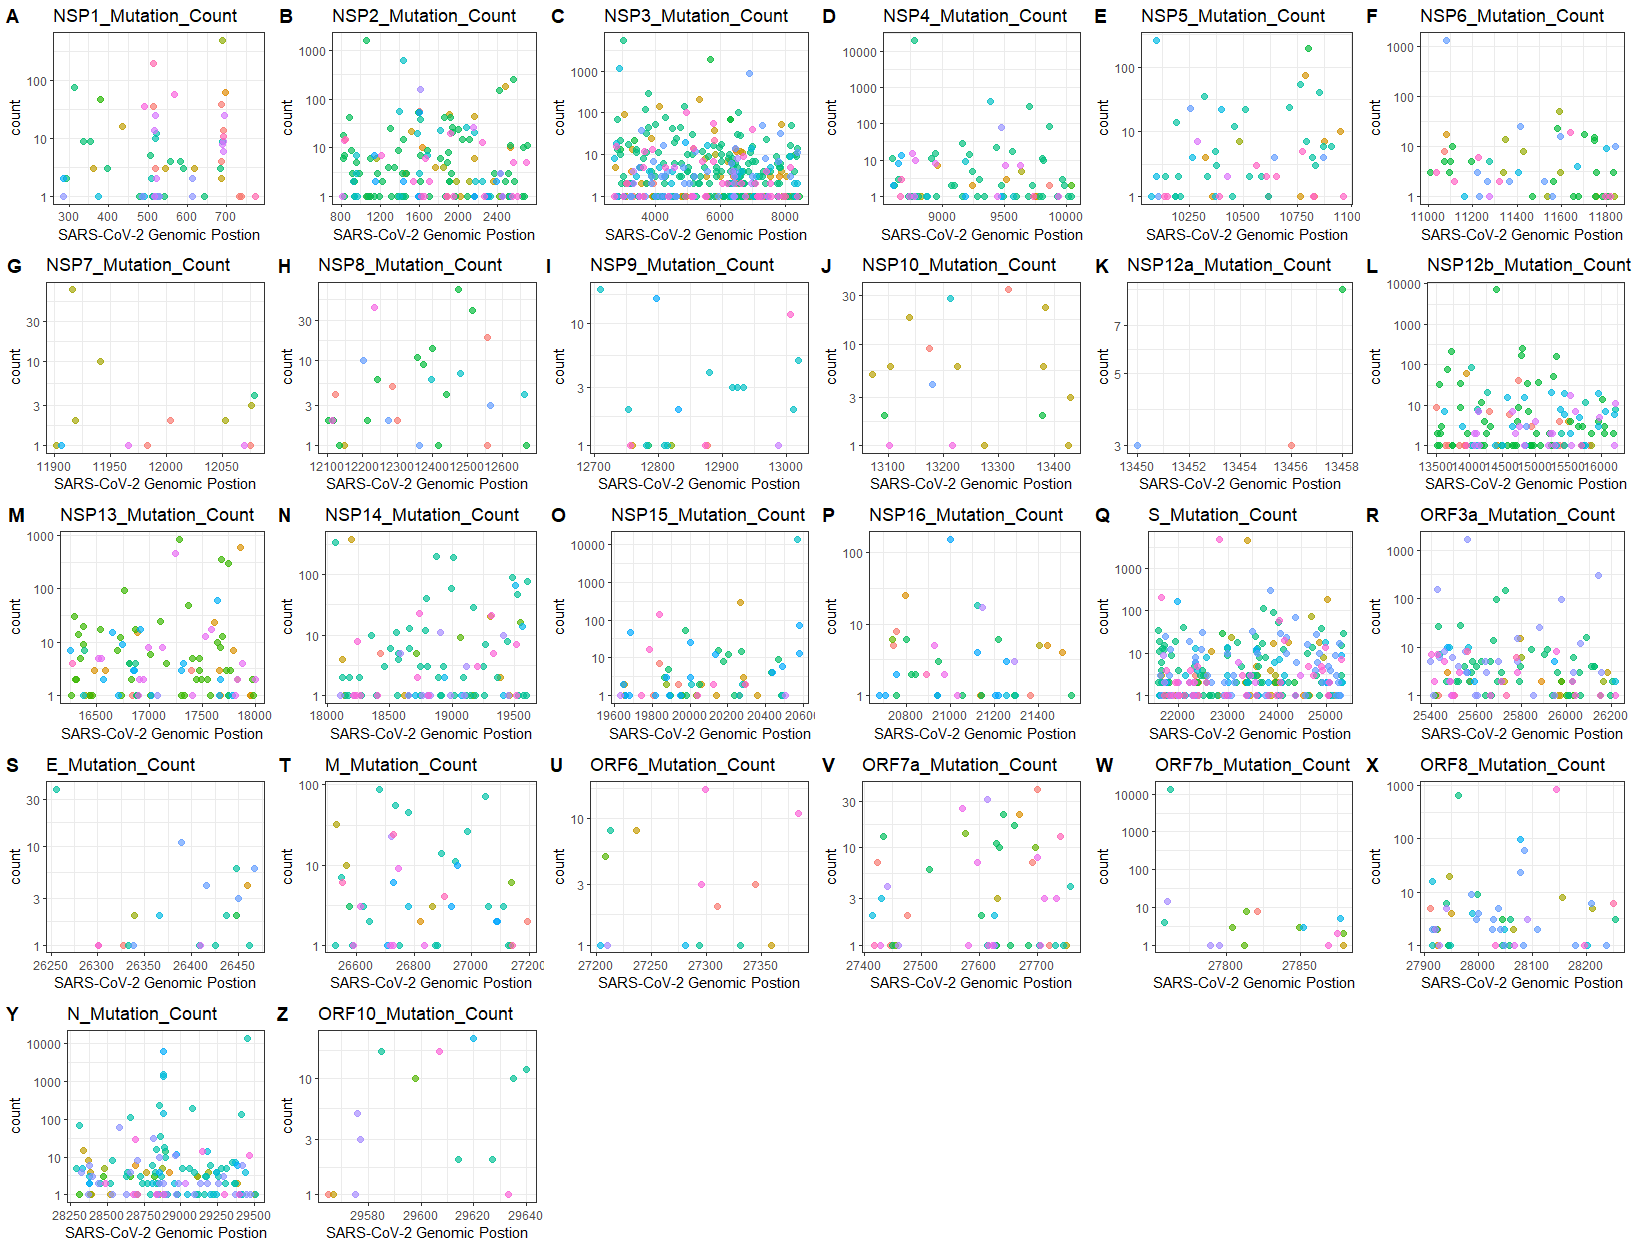
outdir = outdir)Plot mutation counts for certain genes
data("gene_position")
outdir <- tempdir()
MutByGene(nucmerr = nucmerr, gff3 = gene_position, figurelist = TRUE, outdir = outdir)
#if figurelist = TRUE, the recommendation for figure display(in pixel)is: width=1650, height=1300======= #### Further Other functions usage: globalProteinMut, LastfiveNrMutation. etc. Please refer to the vignettes.