![]()
![]()
![]()
![]()
The goal of ‘Rthingsboard’ is to provide interaction with the API of ‘ThingsBoard’ (https://thingsboard.io/), an open-source IoT platform for device management, data collection, processing and visualization.
You can install the released version of ‘Rthingsboard’ from CRAN with:
install.packages("Rthingsboard")And the development version from GitHub with:
# install.packages("devtools")
devtools::install_github("DDorch/Rthingsboard")This is a basic example which shows you how to extract data from the following public dashboard : http://scada.g-eau.fr/dashboard/4db16100-f3e9-11e8-9dbf-cbc1e37c11e3?publicId=299cedc0-f3e9-11e8-9dbf-cbc1e37c11e3
library(Rthingsboard)# Identifier of SupAgro Halle hydraulique SCADA
url = "http://scada.g-eau.fr"
publicId = "299cedc0-f3e9-11e8-9dbf-cbc1e37c11e3"
entityId = "18d56d50-f3e9-11e8-9dbf-cbc1e37c11e3"
startDate = as.POSIXct("2020-11-19 15:00:00", tz = "Europe/Paris")
endDate = as.POSIXct("2020-11-19 18:00:00", tz = "Europe/Paris")
# Set logger threshold to DEBUG to see extra messages for debug purpose
logger::log_threshold(logger::DEBUG)First, you need to create an object of class
ThingsboardApi as follow:
# Connection to the API
tb_api = ThingsboardApi(url = url, publicId = publicId)You can get the available keys on the specified device defined by its
entityId:
# Get list of keys
keys = tb_api$getKeys(entityId = entityId)
Knowing the name of the available keys, you can get the telemetry of
this device for a given period defined by startTS and
endTS.
Here below, we download the telemetry for all keys beginning by “Y”:
df <- tb_api$getTelemetry(entityId,
                       keys = keys[grep("^Y", keys)],
                       startTs = startDate,
                       endTs = endDate)
Here below the first records of the extracted telemetry:
knitr::kable(head(df))| key | ts | value |
|---|---|---|
| Y0 | 2020-11-19 17:59:55 | 2.9683 |
| Y0 | 2020-11-19 17:59:50 | 2.7493 |
| Y0 | 2020-11-19 17:59:45 | 2.6398 |
| Y0 | 2020-11-19 17:59:40 | 2.7493 |
| Y0 | 2020-11-19 17:59:35 | 2.7493 |
| Y0 | 2020-11-19 17:59:30 | 2.7493 |
You can then record this table into a file in the current directory:
# getwd() # to get the path of the current directory
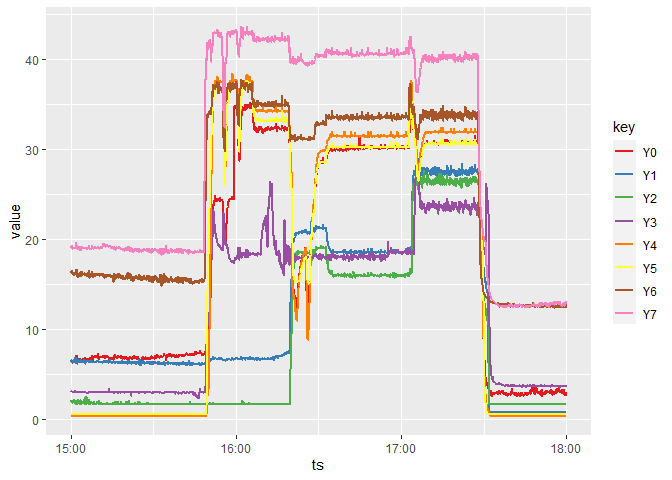
write.csv2(df, "myData.csv")And also plot some time series:
library(ggplot2)
ggplot(df, aes(x = ts, y = value)) +
  geom_line(aes(color = key), size = 1) +
  scale_color_brewer(palette = "Set1")