![]()
SDLfilter contains a variety of functions to screen GPS/Argos locations and to assess the adequacy of sample size of tracking data for animal distribution analysis.
# The official version from CRAN:
install.packages("SDLfilter")

# Or the development version from GitHub:
install.packages("devtools")
devtools::install_github("TakahiroShimada/SDLfilter")library(SDLfilter)There are three main filtering functions.
data(turtle)turtle.dup <- dupfilter(turtle)## Calculate the maximum linear speed between two consecutive locations
V <- vmax(turtle.dup)
## Calculate the maximum one-way linear speed of a loop trip
VLP <- vmaxlp(turtle.dup)
## Run ddfilter
turtle.dd <- ddfilter(turtle.dup, vmax=V, vmaxlp=VLP) # Entire area
p1 <- to_map(turtle.dup, bgmap=Australia, point.size = 2, line.size = 0.5, axes.lab.size = 0,
multiplot = FALSE, point.bg = "red",
title.size=15, title="Entire area")[[1]] +
geom_point(aes(x=lon, y=lat), data=turtle.dd, size=2, fill="yellow", shape=21)+
geom_point(aes(x=x, y=y), data=data.frame(x=c(154, 154), y=c(-22, -22.5)),
size=3, fill=c("yellow", "red"), shape=21) +
annotate("text", x=c(154.3, 154.3), y=c(-22, -22.5), label=c("Retained", "Removed"),
colour="black", size=4, hjust = 0)
# Zoomed in
p2 <- to_map(turtle.dup, bgmap=SandyStrait, xlim=c(152.7, 153.2), ylim=(c(-25.75, -25.24)),
axes.lab.size = 0, point.size = 2, point.bg = "red", line.size = 0.5,
multiplot = FALSE, title.size=15, title="Zoomed in")[[1]] +
geom_path(aes(x=lon, y=lat), data=turtle.dd, size=0.5, colour="black", linetype=1) +
geom_point(aes(x=lon, y=lat), data=turtle.dd, size=2, colour="black", shape=21, fill="yellow")
## plot
gridExtra::grid.arrange(p1, p2, layout_matrix=cbind(1,2))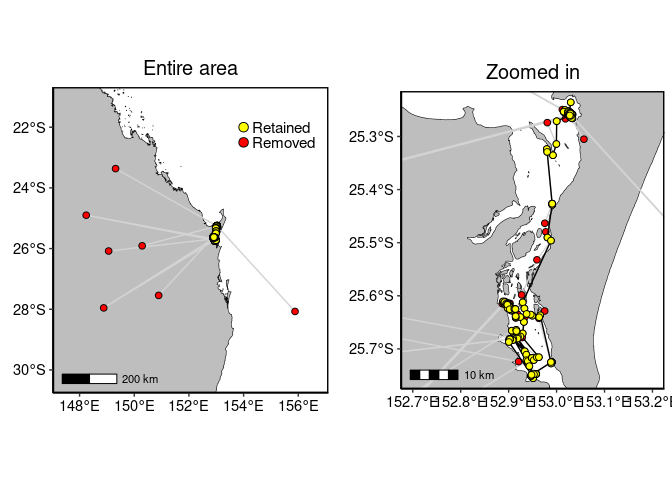
The input data can be either a matrix or a list of RasterLayer objects. Each row of the matrix or each RasterLayer object contains the probability distribution of an animal. The function assumes that each column of a matrix is associated with a unique geographical location, therefore it is critical that the grid size and geographical extent are consistent across UDs. In this example (15 tracks of flatback turtles), the grid size was 1km and the geographical extent was 1901789, 1972789, -2750915, -2653915 (EPSG:3577) across all 15 layers.
library(adehabitatHR); library(raster)

## Tracking data
data(flatback)
flatback <- track_param(flatback, param = "time") # calculate time between successive locations
flatback_id <- unique(flatback$id)


## Data range with 5km buffer
buff <- 5e+3
xmin <- min(flatback$x) - buff; xmax <- max(flatback$x) + buff
ymin <- min(flatback$y) - buff; ymax <- max(flatback$y) + buff

## Make a grid layer
cell.size <- 1e+3 # (1km x 1km)
x <- seq(xmin, xmax, cell.size)
y <- seq(ymin, ymax, cell.size)
xy.df <- expand.grid(x = x, y = y)
xy.coords <- SpatialPixels(SpatialPoints(xy.df))
xy.sp <- SpatialPoints(xy.coords, proj4string = CRS("+init=epsg:3577"))
z <- rep(1, nrow(xy.df))
xyz <- cbind(xy.df, z)
grid_spdf <- SpatialPixelsDataFrame(xy.coords, xyz)

## UD per turtle
ud_raster <- list()
for(i in 1:length(flatback_id)){

  ## ID
  ID <- flatback_id[i]

  ## Tracking data
  turtle.data <- with(flatback, flatback[id %in% ID, ])

  ## Creates an object of class Itraj
  data.ltraj <- with(turtle.data, as.ltraj(turtle.data[,c("x", "y")], date=DateTime, id=ID, burst=ID))

  ## Parameters for BRB
  TM = quantile(turtle.data$pTime, probs = 0.95, na.rm = TRUE)*3600
  LM = 50
  dp = BRB.likD(data.ltraj, Tmax=TM, Lmin=LM)
  HM = 100

  ## Estimate the UD
  ud <- BRB(data.ltraj, D=dp, Tmax=TM, Lmin=LM, hmin=HM, grid=grid_spdf, type="UD")

  ## Convert the UD to raster
  ud_raster[[i]] <- raster(ud)
}
# A matrix
data(ud_matrix)
# Or a list of RasterLayer/SpatRaster
data(ud_raster)It will take some time to run this code depending on the number of iterations and the machine specs. The runtime was about 2.5 minutes for 2000 iterations on a linux machine (Intel i7-4702HQ CPU @ 2.20GHz, 16GB RAM).
overlap <- boot_overlap(ud_matrix, R = 2000, method = "PHR")An asymptote could be considered once the mean overlap probability exceeded 95% of the estimated horizontal asymptote (Shimada et al 2021). The sample size linked to this value is deemed to be the minimum sample size required to represent the general distribution of the group.
a <- asymptote(overlap, upper.degree = 5, estimator = 'glm', family = binomial)ggplot(data = a$results, aes(x = x))+
geom_errorbar(aes(ymin = y_lwr, ymax = y_upr), width = 0.2, colour = 'darkgrey', size = 1) +
geom_point(aes(y = y), size = 2) +
geom_hline(yintercept = a$h.asymptote*0.95, linetype = 2) +
scale_x_continuous(breaks = seq(0, 15, 3), limits = c(1.9,15.1), name = "Animals tracked (n)") +
scale_y_continuous(limits = c(0.5,1), name = "Overlap probability") +
theme_light()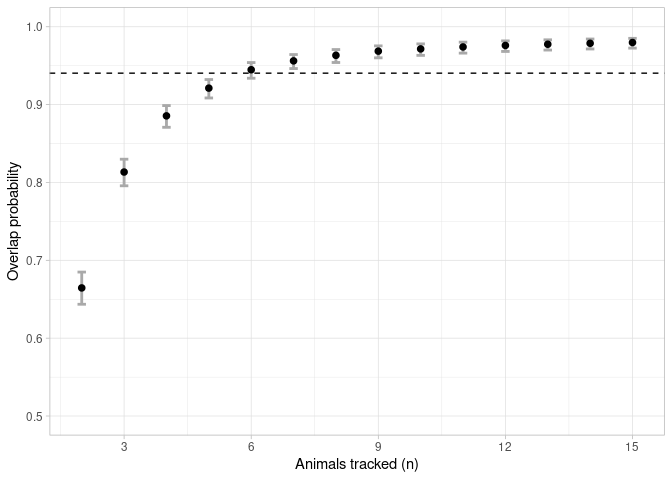
Please see the package help pages and Shimada et al. (2012, 2016, 2021) for more details.
If you use the function ddfilter, please cite
Shimada T, Jones R, Limpus C, Hamann M (2012) Improving data retention and home range estimates by data-driven screening. Mar Ecol Prog Ser 457:171-180 doi: 10.3354/meps09747
If you use the functions dupfilter or depthfilter, please cite
Shimada T, Limpus C, Jones R, Hazel J, Groom R, Hamann M (2016) Sea turtles return home after intentional displacement from coastal foraging areas. Mar Biol 163:1-14 doi: 10.1007/s00227-015-2771-0
If you use the functions asymptote, boot_overlap, combn_overlap or boot_area, please cite
Shimada, T, Thums, M, Hamann, M, et al. (2021) Optimising sample sizes for animal distribution analysis using tracking data. Methods Ecol Evol 12(2):288-297 doi: 10.1111/2041-210X.13506
Version 2.3.3 (2023-11-07)