autoshiny – R package for automatic transformation of an R function into a Shiny app ================ Aleksander Rutkowski 2018-06-14
# if package `devtools` not installed, first do this:
# install.packages('devtools')
devtools::install_github('alekrutkowski/autoshiny')
library(autoshiny)There are two key twin functions: makeApp and
makeFiles. Both of them take a function as their first
argument/parameter. Function makeApp returns a Shiny app
object. makeFiles produces ui.R and
server.R files. These files can be further edited to tweak
the app if needed.
Using autoshiny does not imply any run-time dependency of the compiled app on autoshiny i.e. autoshiny is needed only at the compile time. autoshiny uses standard Shiny input and output widgets and render functions. Tiny helper functions are embedded in the compiled app code to make it self-contained.
All the arguments/parameters of the function passed to
makeApp and makeFiles must have default
values which will be used by autoshiny to define
each argument’s:
The default values of the function arguments/parameters will be also used to pre-evaluate that function in order to test it and to determine the type of its output (return value / side effect) and, hence, the Shiny output widget.
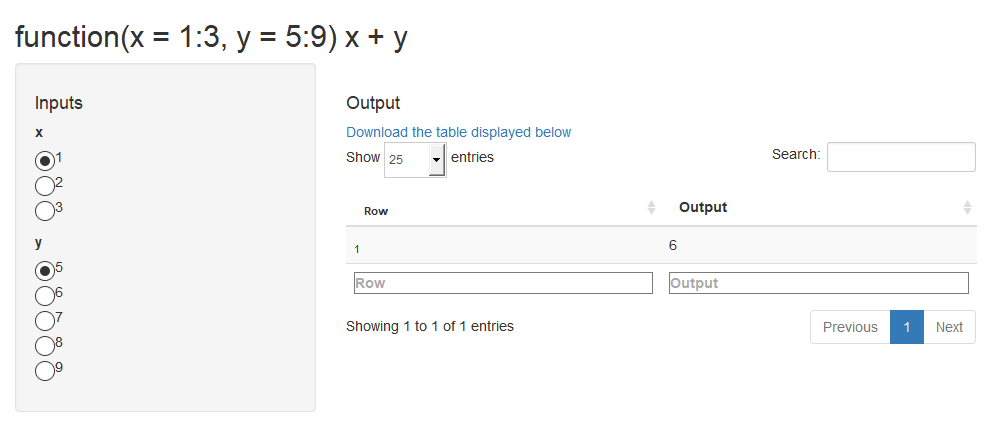
library(shiny)makeApp(function(x=1:3, y=5:9) x+y)
See the source
code generated with makeFiles (and formatted with rfmt) of the app whose
initial-state screenshot is displayed above.
`Histogram for normal distribution` <-
    function(`Number of observations` =
                 as.integer(c(100,10,1000))) # as.integer => the argument interpreted as categorical
        plot(hist(rnorm(`Number of observations`))) # Generic R plots as "return values" are supported

makeApp(`Histogram for normal distribution`)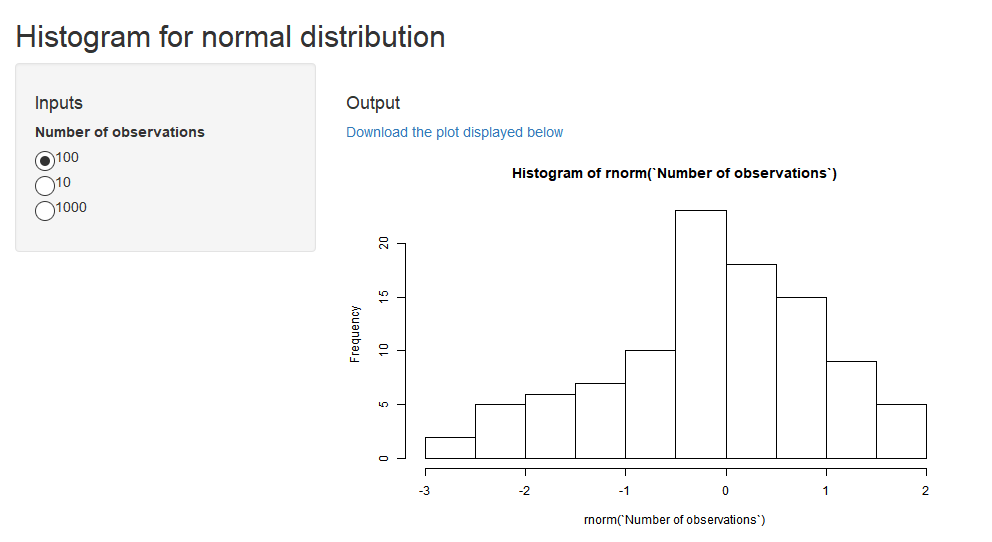
See the source
code generated with makeFiles (and formatted with rfmt) of the app whose
initial-state screenshot is displayed above.
`Table of sin and cos values` <-
    function(`Upload CSV file with column "x"` =
                 data.frame(x = seq(0, 2*pi, .25))) {
        dta <- `Upload CSV file with column "x"`
        data.frame(X = dta$x,
                   `Sin of X` = sin(dta$x),
                   `Cos of X` = cos(dta$x),
                   check.names = FALSE)
    }
makeApp(`Table of sin and cos values`)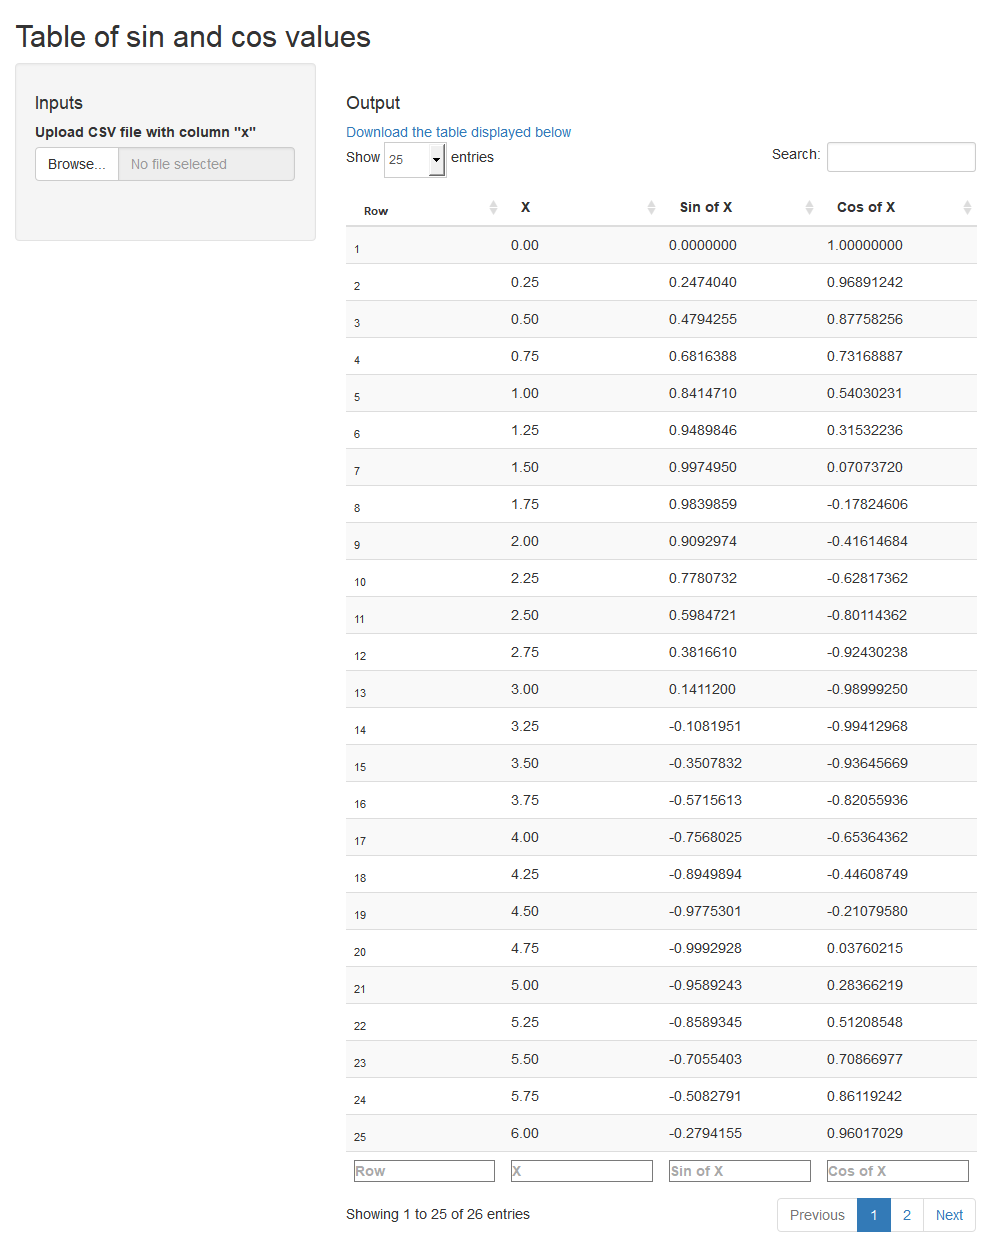
See the source
code generated with makeFiles (and formatted with rfmt) of the app whose
initial-state screenshot is displayed above.
openxlsx::write.xlsx(data.frame(x=1:5,
                                y=11:15),
                     'my_test_file.xlsx')
`Excel file in and out` <-
    function(`Input Excel file` =
                 File('my_test_file.xlsx')) { # File() obligatory here!
        my.data <- openxlsx::read.xlsx(`Input Excel file`)
        my.data2 <- within(my.data,
                           z <- x + y)
        openxlsx::write.xlsx(my.data2,
                             'my_test_file_2.xlsx')
        File('my_test_file_2.xlsx') # File() obligatory here too!
    }
makeApp(`Excel file in and out`)
See the source
code generated with makeFiles (and formatted with rfmt) of the app whose
initial-state screenshot is displayed above.
Use this option if:
`Get "GDP and main components" from Eurostat` <-
    function() {
        # Getting data from
        # http://ec.europa.eu/eurostat/estat-navtree-portlet-prod/BulkDownloadListing?sort=1&file=data%2Fnama_10_gdp.tsv.gz
        x <- eurodata::importData('nama_10_gdp')
        head(x, 10)
    }
makeApp(`Get "GDP and main components" from Eurostat`,
        withGoButton = TRUE)
See the source
code generated with makeFiles (and formatted with rfmt) of the app whose
initial-state screenshot is displayed above.
`A function with lists everywhere` <-
    function(`First argument group,` = list(`number one` = 1:3,
                                           `number two` = letters[1:3]),
             `2nd arg group,` = list(`1st argument` = 11:14,
                                    `second arg.` = LETTERS[1:5]))
        list(`Some text` =
                 as.character(c(`First argument group,`$`number two`,
                              `2nd arg group,`$`second arg.`)),
             `Some numbers` =
                 `First argument group,`$`number one` +
                 `2nd arg group,`$`1st argument`,
             `Even a ggplot2 chart` =
                 ggplot2::qplot(a,b,data=data.frame(a=1:20,b=log(1:20))))
makeApp(`A function with lists everywhere`)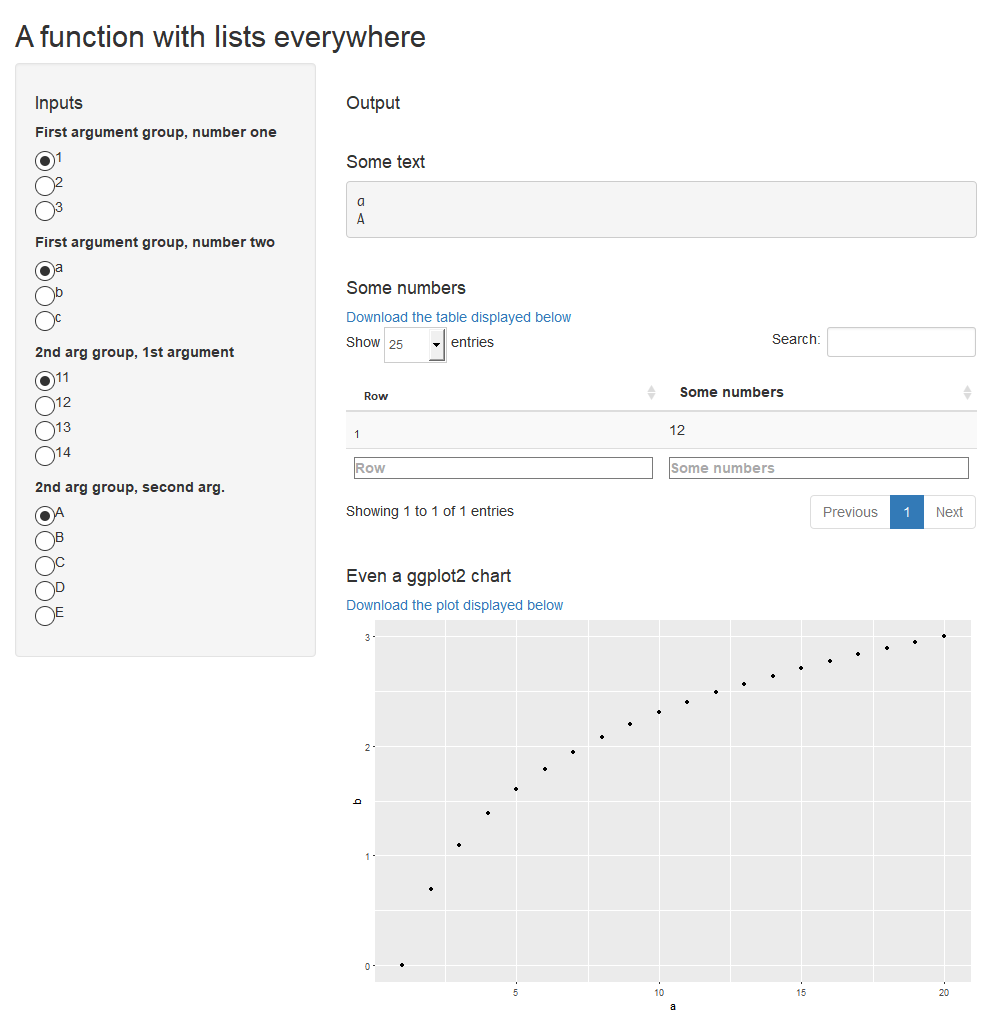
See the source
code generated with makeFiles (and formatted with rfmt) of the app whose
initial-state screenshot is displayed above.