
![]()
![]()
![]()
![]()
Package ‘ggpp’ provides a set of building blocks
that extend the Grammar of Graphics implemented in package ‘ggplot2’
(>= 3.5.0). The extensions enhance the support of data labels and
annotations in plots. Position functions implement new approaches to
nudging usable with any geometry, but especially useful together with
geom_text_s() and geom_label_s() from this
package and geom_text_repel() and
geom_label_repel() from package ‘ggrepel’ (>= 0.9.2).
See: (https://ggrepel.slowkow.com) for installation
instructions and news about releases.
Normalised Parent Coordinates (NPC) are supported natively by
‘ggplot2’ >= 3.5.0 by means of R’s identity function
I(). This new approach does not require special geometries
as it should work with almost every existing geometry. However,
currently this works only when continuous variables are mapped to the
x and/or y aesthetics. If this mechanism is extended
to support factors and other discrete variables in the future, all the
_npc geometries from ‘ggpp’ could become redundant.
Meanwhile, these special geometries from ‘ggpp’ still fill a gap, albeit
a smaller one, in the support of NPC by ‘ggplot2’.
The distinction between observations or data mapped to x and y aesthetics and data labels is that data labels are linked to a the coordinates of the data, but their own location is usually nearby but not exactly that of the data. In other words the location of a data label in x and y coordinates is flexible as long as the link to a data observation can be inferred. In the case of annotations the location on the plotting area is arbitrary, dictated by available graphic design considerations and the requirement of not occluding data observations. In the table below we list for the geometries defined in package ‘ggpp’: 1) whether they are intended for data labels, annotations or data, 2) the aesthetics and pseudo-aesthetics they obey, and 3) whether they can connect the original data position to the displaced position. The drawing of connecting segments or arrows between the displaced and original positions, those of the observation and the displaced label, requires also a change in the data returned by position functions (see the next section).
| Geometry | Main use | Aesthetics | Segment |
|---|---|---|---|
geom_text_s() |
data labels | x, y, label, size, family, font face, colour, alpha, group, angle, vjust, hjust | yes |
geom_label_s() |
data labels | x, y, label, size, family, font face, colour, fill, alpha, linewidth, linetype, group, vjust, hjust | yes |
geom_text_pairwise() |
data labels | x, xmin, xmax, y, label, size, family, font face, colour, alpha, group, angle, vjust, hjust | horiz. |
geom_label_pairwise() |
data labels | x, xmin, xmax, y, label, size, family, font face, colour, fill, alpha, linewidth, linetype, group, vjust, hjust | horiz. |
geom_point_s() |
data labels | x, y, size, colour, fill, alpha, shape, stroke, group | yes |
geom_table()1 |
data labels | x, y, label, size, family, font face, colour, alpha, group, angle, vjust, hjust | yes |
geom_plot()1,
geom_grob()1 |
data labels | x, y, label, group, angle, vjust, hjust | yes |
geom_margin_arrow() |
data labels, scale labels, data | xintercept, yintercept, label, size, family, font face, colour, alpha, group, vjust, hjust | no |
geom_margin_point() |
data labels, scale labels, data | xintercept, yintercept, label, size, family, font face, colour, alpha, group, vjust, hjust | no |
geom_margin_grob() |
data labels, scale labels, data | xintercept, yintercept, label, size, family, font face, colour, alpha, group, vjust, hjust | no |
geom_quadrant_lines() ,
geom_vhlines() |
data labels, scale labels, data | xintercept, yintercept, label, size, family, font face, colour, alpha, group, vjust, hjust | no |
Table 1. Geometries defined in package ‘ggpp’.
1 NPC versions exist for these geometries, as well as for
geom_text() and geom_label(), used mainly for
plot annotations.
In contrast to position functions from ‘ggplot2’ all the position
functions from package ‘ggpp’ are able keep the original x and
y coordinates under a different name in the data
object returned when x and/or y are displaced to a new
position. This makes them compatible with geom_text_s(),
geom_label_s(), geom_point_s(),
geom_table(), geom_plot() and
geom_grob() from this package. All these geoms can draw
segments or arrows connecting the original positions to the displaced
positions. All position functions in ‘ggpp’ are backwards compatible
with those from ‘ggplot2’ and can be used in all geometries that have a
position formal parameter. This approach is similar to that
used in package ‘ggrepel’ (<= 0.9.1) but uses a different naming
convention. In ‘ggrepel’ (>= 0.9.2) geometries
geom_text_repel() and geom_label_repel() are
fully compatible with this new naming convention.
Position functions position_nudge_to(),
position_nudge_center() and
position_nudge_line() implement new flavours of nudging.
Function position_nudge_to() can be used to nudge labels by
giving the coordinates of their positions. Functions
position_nudge_center() and
position_nudge_line() make it possible to apply nudging
that depends on the position of the labelled data points with respect to
a focus point or a line. The focus point can be be passed as coordinates
or computed from the data. The line or curve can be passed in the call
or it can be a a polynomial or smoothing spline fitted on-the-fly to the
the observations.
Function position_stack_minmax() makes it possible to
add error bars to stacked columns.
Functions position_nudge_keep(),
position_jitter_keep(), position_stack_keep(),
position_fill_keep(), position_dodge_keep(),
position_dosge2_keep() behave like the positions from
‘ggplot2’ but keep in the data object the original
coordinates.
Position functions position_stacknudge(),
position_fillnudge(), position_jitternudge(),
position_dodgenudge(),
position_dodge2nudge(),position_stacknudge_to(),
position_fillnudge_to(),
position_dodgenudge_to() and
position_dodge2nudge_to() combine the roles of two
position functions. They make it possible to easily nudge
labels in plot layers that use stacking, dodging or jitter. In these
functions the coordinates stored as “original” can be either those
before applying any displacement or those after applying the first of
the two displacements, which are applied in the sequence they appear in
the function names.
| Position | Main use | Displacement | Most used with |
|---|---|---|---|
position_nudge_keep() |
nudge | x, y (fixed distance) | data labels |
position_jitter_keep() |
jitter | x, y (random) | dot plots |
position_stack_keep() |
stack | vertical (absolute) | column and bar plots |
position_stack_minmax() |
stack | vertical (absolute) | error bars |
position_fill_keep() |
fill | vertical (relative, fractional) | column plots |
position_dodge_keep() |
dodge | sideways (absolute) | column and bar plots |
position_dosge2_keep() |
dodge2 | sideways (absolute) | box plots |
position_nudge_to() |
nudge | x, y (fixed position) | data labels |
position_nudge_center() |
nudge | x, y (away or towards target) | data labels |
position_nudge_line() |
nudge | x, y (away or towards target) | data labels |
position_stacknudge() |
stack + nudge | combined, see above | data labels in column plots |
position_fillnudge() |
fill + nudge | combined, see above | data labels in column plots |
position_jitternudge() |
jitter + nudge | combined, see above | data labels in dot plots |
position_dodgenudge() |
dodge + nudge | combined, see above | data labels in column plots |
position_dodge2nudge() |
dodge2 + nudge | combined, see above | data labels in box plots |
position_stacknudge_to() |
stack + nudge | combined, see above | data labels in column plots |
position_fillnudge_to() |
fill + nudge | combined, see above | data labels in column plots |
position_dodgenudge_to() |
dodge + nudge | combined, see above | data labels |
position_dodge2nudge_to() |
dodge2 + nudge | combined, see above | data labels in box plots |
Table 2. Position functions defined in package ‘ggpp’.
Statistic stat_fmt_tb() helps with the formatting of
tables to be plotted with geom_table().
Two statistics, stat_dens2d_filter(), and
stat_dens2d_label() implement tagging or selective
labelling of observations based on the local 2D density of observations.
Similarly, stat_dens1d_filter() and
stat_dens1d_label() implement selective tagging or
labelling of observation based on the 1D density of observations. These
four statistics compute the local density per plot panel. In contrast
stat_dens1d_filter_g() and
stat_dens1d_filter_g() compute the density by group of
observations. These six statistics are designed to work well together
with geom_text_repel() and geom_label_repel()
from package ‘ggrepel’ (>= 0.9.2) and
geom_marquee_repel() from ‘ggrepel’ (> 0.9.6).
The statistics stat_apply_panel() and
stat_apply_group() are useful for applying arbitrary
functions returning numeric vectors like cumsum(),
cummax() and diff(). Statistics
stat_centroid() and stat_summary_xy() allow
computation of summaries on both x and y and passing
them to a geom.
The statistics stat_quadrant_counts() and
stat_panel_counts() make it easy to annotate plots with the
number of observations.
stat_functions() is similar to statistic
stat_function() from ‘ggplot2’ but accepts a list of
function definitions mapped to the y aesthetic, providing
the sane flexibility in relation to grouping and facets as statistics
accepting numeric vectors mapped to the y
aesthetic.
| Statistic | Main use | Usual geometries | Most used with | Compute function |
|---|---|---|---|---|
stat_fmt_tb() |
formatting and selection | geom_table() |
tables as data labels | group |
stat_fmt_tb() |
formatting and selection | geom_table_npc() |
tables as annotations | group |
stat_dens2d_filter() |
local 2D density filtering | geom_text_s(), geom_label_s(),
geom_text(), geom_label() |
text as data labels | panel |
stat_dens2d_label() |
local 2D density filtering | geom_text_repel(), geom_label_repel() |
text as data labels | panel |
stat_dens1d_filter() |
local 1D density filtering | geom_text_s(), geom_label_s(),
geom_text(), geom_label() |
text as data labels | panel |
stat_dens1d_label() |
local 1D density filtering | geom_text_repel(), geom_label_repel() |
text as data labels | panel |
stat_dens2d_filter_g() |
local 2D density filtering | geom_text_s(), geom_label_s(),
geom_text(), geom_label() |
text as data labels | group |
stat_dens2d_label_g() |
local 2D density filtering | geom_text_repel(), geom_label_repel() |
text as data labels | group |
stat_dens1d_filter_g() |
local 1D density filtering | geom_text_s(), geom_label_s(),
geom_text(), geom_label() |
text as data labels | group |
stat_dens1d_label_g() |
local 1D density filtering | geom_text_repel(), geom_label_repel() |
data labels | group |
stat_panel_counts() |
number of observations | geom_text(), geom_label() |
text as annotation | panel |
stat_group_counts() |
number of observations | geom_text(), geom_label() |
text as annotation | panel |
stat_quadrant_counts() |
number of observations | geom_text(), geom_label() |
text as annotation | panel |
stat_apply_panel() |
cumulative summaries | geom_point(), geom_line(), etc. |
scatter and line plots | panel |
stat_apply_group() |
cumulative summaries | geom_point(), geom_line(), etc. |
scatter and line plots | group |
stat_centroid() |
joint x and y summaries | geom_point(), geom_rug(),
geom_margin_arrow(), etc. |
data summary | group |
stat_summary_xy() |
joint x and y summaries | geom_point(), geom_rug(),
geom_margin_arrow(), etc. |
data summary | group |
stat_functions() |
compute y from x range | geom_line(), geom_point(), etc. |
draw function curves | group |
Table 3. Statistics defined in package ‘ggpp’. Columns show their most common uses and geoms. In many cases, the default aesthetic mappings in the statistics support multiple geoms.
Justifications "outward_mean",
"inward_mean", "outward_median" and
"inward_median" implement outward and inward justification
relative to the centroid of the data instead of to the centre of the
\(x\) or \(y\) scales. Justification outward or inward
from an arbitrary origin is also supported. Justification
"position" implements justification at the edge nearest to
the original position. This works only together with position functions
that save the original location using the naming convention implemented
in ‘ggpp’, otherwise default justification falls-back to
"center"/"middle".
This package is a “spin-off” from package ‘ggpmisc’ containing extensions to the grammar originally written for use within ‘ggpmisc’. As ‘ggpmisc’ had grown in size, splitting it into two packages was necessary to easy development and maintenance and to facilitate imports into other packages. For the time being, package ‘ggpmisc’ imports and re-exports all visible definitions from ‘ggpp’.
The plots below exemplify some of the things that ‘ggpp’ makes possible or makes easier to code compared to ‘ggplot2’ used on its own. Additional examples including several combining ‘ggpp’ and ‘ggrepel’ are provided in the package vignette and package web pages.
library(ggpp)
library(ggrepel)
library(dplyr)A plot with an inset table.
mtcars %>%
  group_by(cyl) %>%
  summarize(wt = mean(wt), mpg = mean(mpg)) %>%
  ungroup() %>%
  mutate(wt = sprintf("%.2f", wt),
         mpg = sprintf("%.1f", mpg)) -> tb

df <- tibble(x = 5.45, y = 34, tb = list(tb))

ggplot(mtcars, aes(wt, mpg, colour = factor(cyl))) +
  geom_point() +
  geom_table(data = df, aes(x = x, y = y, label = tb))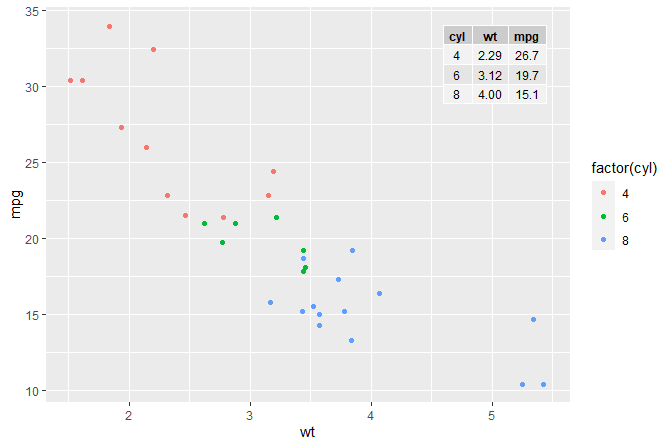
Figure 1. A scatter plot with an inset table displaying group means.
Inset plot positioned using native plot coordinates (npc) using
numerical values in the range 0..1 together with I().
p <- ggplot(mtcars, aes(factor(cyl), mpg, colour = factor(cyl))) +
  stat_boxplot() +
  labs(y = NULL, x = "Engine cylinders (number)") +
  theme_bw(9) + theme(legend.position = "none")

ggplot(mtcars, aes(wt, mpg, colour = factor(cyl))) +
  geom_point(show.legend = FALSE) +
  annotate("plot", x = I(0.05), y = I(0.05), label = p,
           hjust = "inward", vjust = "inward") +
  expand_limits(y = 0, x = 0)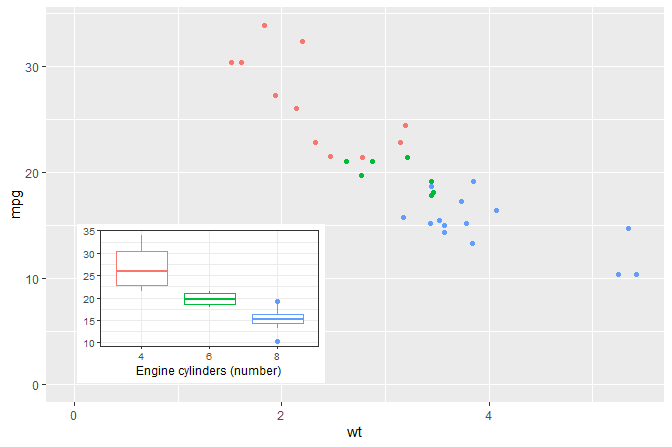
Figure 2. A scatter plot with a boxplot from the same data as an inset.
Means computed on-the-fly and shown as asterisks.
ggplot(mtcars, aes(wt, mpg, colour = factor(cyl))) +
  geom_point() +
  stat_centroid(shape = "asterisk", size = 6)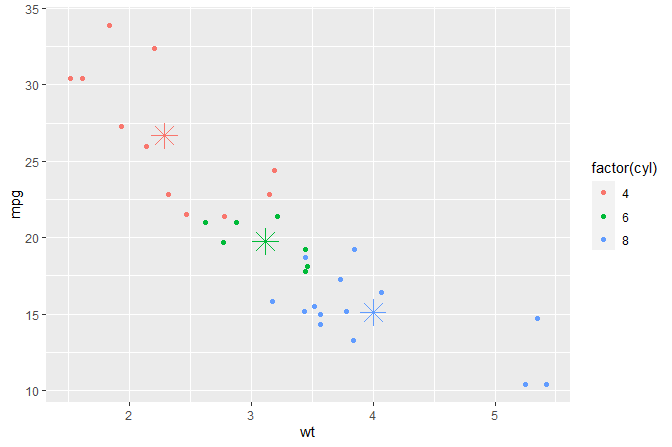
Figure 3. A scatter plot with the group centroids overplotted.
ggplot(mtcars, aes(wt, mpg, colour = factor(cyl))) +
  geom_point() +
  stat_centroid(geom = "y_margin_arrow", .fun = median,
                aes(yintercept = after_stat(y)), arrow.length = 0.05) +
  stat_group_counts(vstep = 0, hstep = 0.09)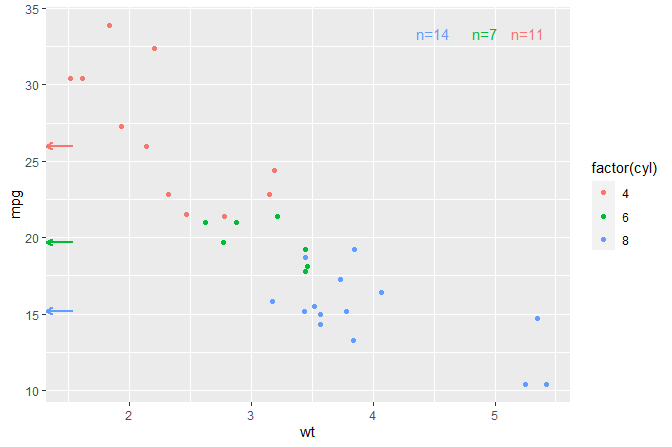
Figure 4. A scatter plot with the group y-medians (computed on-the-fly) shown with arrows on the inside of the y-axis. Labels show the number of observations per group.
df <- data.frame(x1 = c(1, 2, 1, 3, -1),
                 x2 = c("a", "a", "b", "b", "b"),
                 grp = c("some long name", "other name", "some name",
                         "another name", "a name"))

# Add labels to a horizontal column plot (stacked by default)
ggplot(data = df, aes(x2, x1, group = grp)) +
  geom_col(aes(fill = grp), width=0.5) +
  geom_hline(yintercept = 0) +
  geom_text(
    aes(label = grp),
    position = position_stacknudge(vjust = 1, y = -0.2)) +
  theme(legend.position = "none")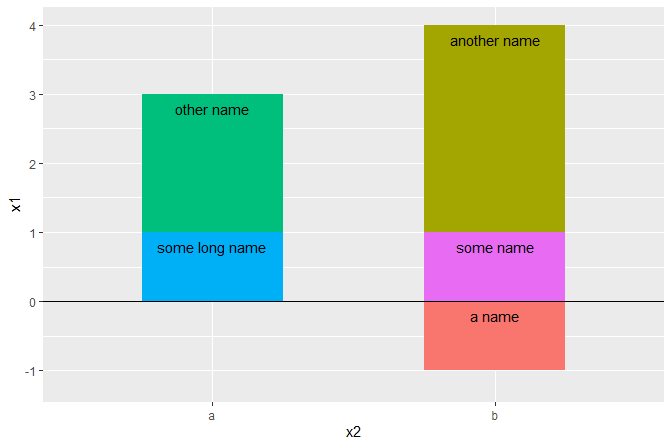
Figure 5. Stacked bar plot with bars annotated just below their tops with their group label.
Installation of the most recent stable version from CRAN (sources, Mac and Win binaries):
install.packages("ggpp")Installation of the current unstable version from R-Universe CRAN-like repository (binaries for Mac, Win, Webassembly, and Linux, as well as sources available):
install.packages('ggpp',
                 repos = c('https://aphalo.r-universe.dev',
                           'https://cloud.r-project.org'))
Installation of the current unstable version from GitHub (from sources):
# install.packages("devtools")
devtools::install_github("aphalo/ggpp")HTML documentation for the package, including help pages and the User Guide, is available at (https://docs.r4photobiology.info/ggpp/).
News about updates are posted at (https://www.r4photobiology.info/).
Chapter 7 in Aphalo (2020) and Chapter 9 in Aphalo (2024) explain basic concepts of the grammar of graphics as implemented in ‘ggplot2’ as well as extensions to this grammar including several of those made available by packages ‘ggpp’ and ‘ggpmisc’. Information related to the book is available at https://www.learnr-book.info/.
Please report bugs and request new features at (https://github.com/aphalo/ggpp/issues). Pull requests are welcome at (https://github.com/aphalo/ggpp).
If you use this package to produce scientific or commercial publications, please cite according to:
citation("ggpp")
#> To cite package 'ggpp' in publications use:
#>
#>   Aphalo P (2026). _ggpp: Grammar Extensions to 'ggplot2'_. R package
#>   version 0.5.9.9904, <https://docs.r4photobiology.info/ggpp/>.
#>
#> A BibTeX entry for LaTeX users is
#>
#>   @Manual{,
#>     title = {ggpp: Grammar Extensions to 'ggplot2'},
#>     author = {Pedro J. Aphalo},
#>     year = {2026},
#>     note = {R package version 0.5.9.9904},
#>     url = {https://docs.r4photobiology.info/ggpp/},
#> }Being an extension to package ‘ggplot2’, some of the code in package
‘ggpp’ has been created by using as a template that from layer
functions, positions and scales in ‘ggplot2’. The user interface of
‘ggpp’ aims at being as consistent as possible with ‘ggplot2’ and the
layered grammar of graphics (Wickham 2010). New features added in
‘ggplot2’ are added when relevant to ‘ggpp’, such as support for
orientation for flipping of layers. This package does
consequently indirectly include significant contributions from several
of the authors and maintainers of ‘ggplot2’, listed at (https://ggplot2.tidyverse.org/).
Coordination of development through a friendly exchange of ideas and reciprocal contributions by Kamil Slowikowski to ‘ggpp’ and by myself to ‘ggrepel’ has made the two packages fully inter-compatible.
Aphalo, Pedro J. (2024) Learn R: As a Language. 2ed. The R Series. Boca Raton and London: Chapman and Hall/CRC Press. ISBN: 9781032516998. 466 pp.
Aphalo, Pedro J. (2020) Learn R: As a Language. 1ed. The R Series. Boca Raton and London: Chapman and Hall/CRC Press. ISBN: 9780367182533. 350 pp.
Wickham, Hadley. 2010. “A Layered Grammar of Graphics.” Journal of Computational and Graphical Statistics 19 (1): 3–28. https://doi.org/10.1198/jcgs.2009.07098.
© 2016-2026 Pedro J. Aphalo (pedro.aphalo@helsinki.fi). Released under the GPL, version 2 or greater. This software carries no warranty of any kind.