The objective of ggrefine is to provide complete themes for publication-quality ‘ggplot2’ visualisation. Functions are provided to modify these based on the positional axis scales and orientation of a particular plot.
Install from CRAN, or development version from GitHub.
install.packages("ggrefine")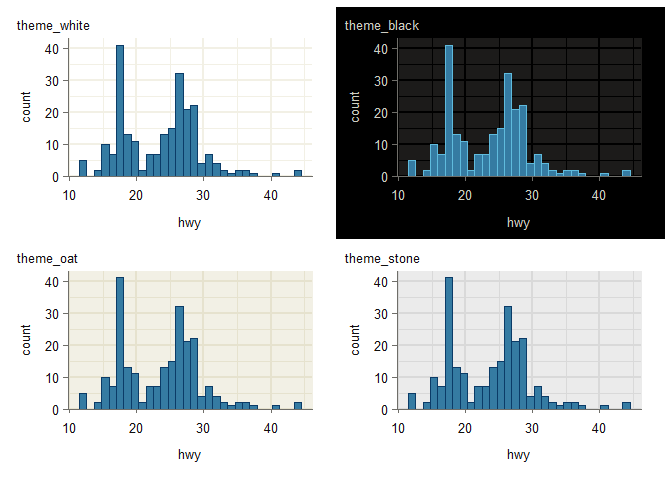
pak::pak("davidhodge931/ggrefine")The themes are built to work with the refine functions in that they have all axis and panel grid elements.
They can also be customised easily.
The theme_grey function has a smart
panel_grid_colour default that is derived from the
panel_background_fill.
To ensure ggrefine theme_* functions are preferred over
ggplot2 functions:
library(ggrefine) after the ggplot2 library is
loaded, orconflicted::conflict_prefer_all(winner = "ggrefine"),
orggrefine::theme_grey() etc.library(ggplot2)
library(ggrefine)
p_base_light <- mpg |>
ggplot(aes(x = hwy)) +
geom_histogram(
stat = "bin", shape = 21,
colour = blends::multiply("#357BA2FF")
) +
scale_y_continuous(expand = expansion(mult = c(0, 0.05)))
p_base_dark <- mpg |>
ggplot(aes(x = hwy)) +
geom_histogram(
stat = "bin", shape = 21,
colour = blends::screen("#357BA2FF")
) +
scale_y_continuous(expand = expansion(mult = c(0, 0.05)))
p_light <- p_base_light + theme_light() + labs(title = "theme_light")
p_dark <- p_base_dark + theme_dark() + labs(title = "theme_dark")
p_grey <- p_base_light + theme_grey() + labs(title = "theme_grey")
p_ggplot2 <- p_base_light + theme_grey(panel_grid_colour = "white") +
labs(title = "theme_ggplot")
patchwork::wrap_plots(
p_light,
p_dark,
p_grey,
p_ggplot2
)
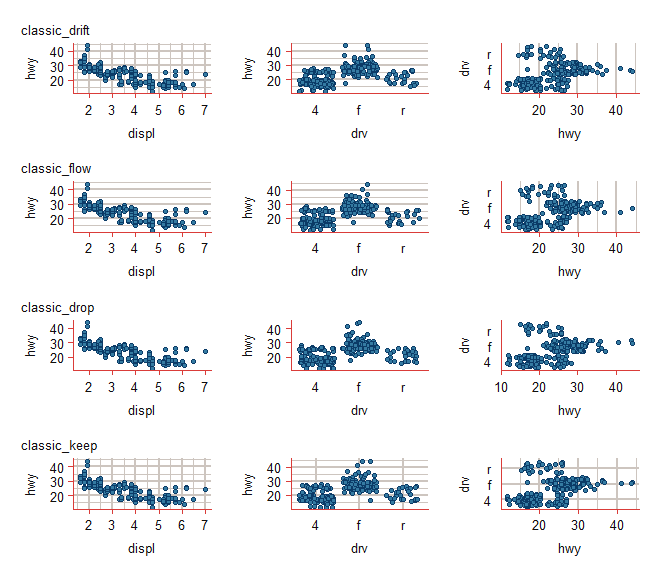
A series of refine functions are provided.
The premise is that it is useful to set themes that have all axis and panel grid elements - and then adjust depending on the positional axis scales and orientation of a particular plot.
The refine functions are organised and named by:
classic_*, modern_*,
minimal_*, and void_*.*_drift, *_flow,
*_drop, *_keep.These functions then remove or not particular axis and panel grid components for different positional scales (and the intended orientation of the plot).
set_theme(new = theme_light(
  panel_grid_colour = jumble::grey,
  axis_line_colour = jumble::red,
))

p_continuous <- mpg |>
  ggplot(aes(x = displ, y = hwy)) +
  geom_point(shape = 21, colour = blends::multiply("#357BA2FF"))

p_discrete_x <- mpg |>
  ggplot(aes(x = drv, y = hwy)) +
  geom_jitter(shape = 21, colour = blends::multiply("#357BA2FF"))

p_discrete_y <- mpg |>
  ggplot(aes(x = hwy, y = drv)) +
geom_jitter(shape = 21, colour = blends::multiply("#357BA2FF"))patchwork::wrap_plots(
p_continuous + classic_drift() + labs(title = "classic_drift"),
p_discrete_x + classic_drift(discrete = "x"),
p_discrete_y + classic_drift(discrete = "y"),
p_continuous + classic_flow() + labs(title = "classic_flow"),
p_discrete_x + classic_flow(discrete = "x"),
p_discrete_y + classic_flow(discrete = "y"),
p_continuous + classic_drop() + labs(title = "classic_drop"),
p_discrete_x + classic_drop(discrete = "x"),
p_discrete_y + classic_drop(discrete = "y"),
p_continuous + classic_keep() + labs(title = "classic_keep"),
p_discrete_x + classic_keep(discrete = "x"),
p_discrete_y + classic_keep(discrete = "y"),
ncol = 3
)
patchwork::wrap_plots(
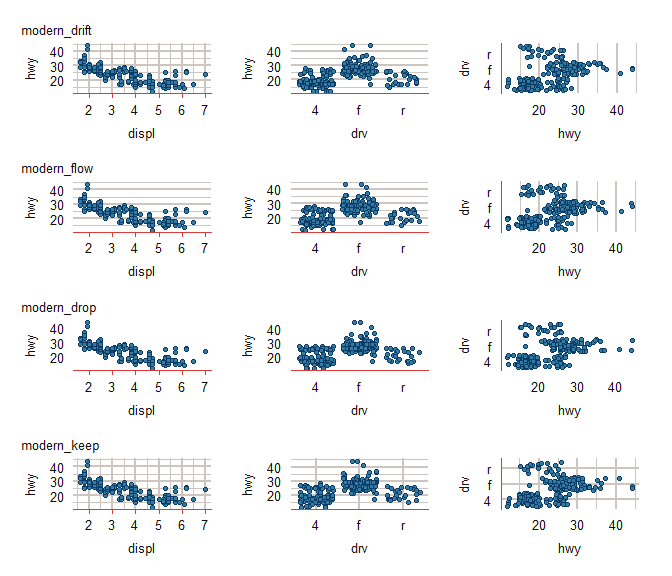
p_continuous + modern_drift() + labs(title = "modern_drift"),
p_discrete_x + modern_drift(discrete = "x"),
p_discrete_y + modern_drift(discrete = "y"),
p_continuous + modern_flow() + labs(title = "modern_flow"),
p_discrete_x + modern_flow(discrete = "x"),
p_discrete_y + modern_flow(discrete = "y"),
p_continuous + modern_drop() + labs(title = "modern_drop"),
p_discrete_x + modern_drop(discrete = "x"),
p_discrete_y + modern_drop(discrete = "y"),
p_continuous + modern_keep() + labs(title = "modern_keep"),
p_discrete_x + modern_keep(discrete = "x"),
p_discrete_y + modern_keep(discrete = "y"),
ncol = 3
)
patchwork::wrap_plots(
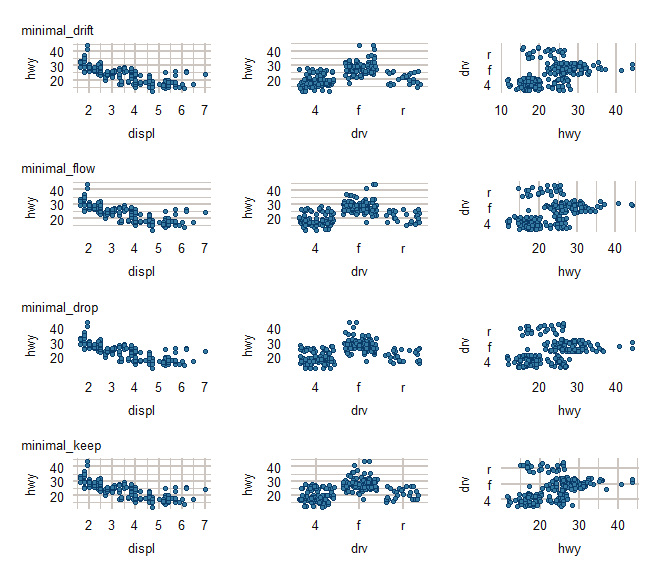
p_continuous + minimal_drift() + labs(title = "minimal_drift"),
p_discrete_x + minimal_drift(discrete = "x"),
p_discrete_y + minimal_drift(discrete = "y"),
p_continuous + minimal_flow() + labs(title = "minimal_flow"),
p_discrete_x + minimal_flow(discrete = "x"),
p_discrete_y + minimal_flow(discrete = "y"),
p_continuous + minimal_drop() + labs(title = "minimal_drop"),
p_discrete_x + minimal_drop(discrete = "x"),
p_discrete_y + minimal_drop(discrete = "y"),
p_continuous + minimal_keep() + labs(title = "minimal_keep"),
p_discrete_x + minimal_keep(discrete = "x"),
p_discrete_y + minimal_keep(discrete = "y"),
ncol = 3
)
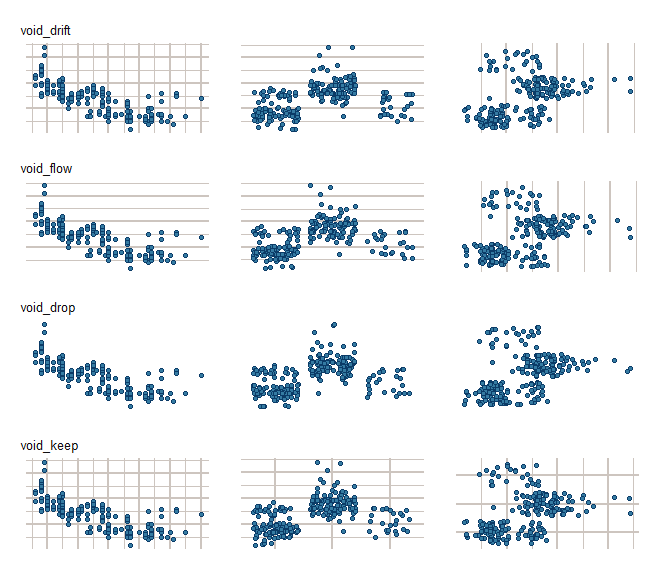
patchwork::wrap_plots(
  p_continuous + void_drift() + labs(title = "void_drift"),
  p_discrete_x + void_drift(discrete = "x"),
  p_discrete_y + void_drift(discrete = "y"),

  p_continuous + void_flow() + labs(title = "void_flow"),
  p_discrete_x + void_flow(discrete = "x"),
  p_discrete_y + void_flow(discrete = "y"),

  p_continuous + void_drop() + labs(title = "void_drop"),
  p_discrete_x + void_drop(discrete = "x"),
  p_discrete_y + void_drop(discrete = "y"),

  p_continuous + void_keep() + labs(title = "void_keep"),
  p_discrete_x + void_keep(discrete = "x"),
  p_discrete_y + void_keep(discrete = "y"),

  ncol = 3
)
This package is part of a group of related packages built to extend ggplot2.
|
|
|
|
|
|
|