loon is an extendible interactive data visualization system designed for exploratory visualization.
Though primarily for exploratory data analysis, it can also be used to develop new interactive analysis and teaching tools. Some sense of the breadth of application and possible extensions can be seen in the various vignettes, demos, and examples in the documentation.
Some sense of the use of loon can be had from the articles, especially the introduction, available here.
In addition to the R package documentation we also have
both TCL and R documentation here.
Once in R, these are accessible from loon as
# Combined TCL and R documentation (a learning document)
l_help()

# R only manual
l_web()

l_web(directory = "articles")

# R system documentation
help(package = loon")

vignette(package = "loon")

demo(package = "loon")The interactive graphics in loon are written on TCL, accessible to R via the tcltk R package. Be sure to have a version of R that includes Tcl/Tk 8.6.6 (which happens by default but might be missing if you have a custom R build).
# The easiest way to install loon
install.packages("loon")

# You could also install the latest development release directly from GitHub
devtools::install_github("great-northern-diver/loon", subdir = "R")
# Or, to ensure you have the vignettes as well
# (  also accessible via l_web(directory = "articles")  )
devtools::install_github("great-northern-diver/loon", subdir = "R",
build_opts = c("--no-resave-data") )It is best to use loon in RStudio or within a terminal.
The Rgui app on OSX does not work well with loon.
The default Windows R GUI will not accept debug messages from Tcl, so for now you need to use RStudio or the terminal.
Mac users need to install XQuartz
On Ubuntu one should install the libtk-img debian package (e.g. with sudo apt-get install libtk-img) in order to get a wide variety of export formats with the l_export function.
Once loon is installed, work your way through the introductory vignette:
library(loon)
#
# from the vignette in R
vignette("introduction", package = "loon")
#
# or via the web
l_web(page = "introduction", directory = "articles")The data used in this demo is quakes giving the
locations, depth, Richter magnitude of earthquakes of Fiji since
1964.
The binsize can be modified by the graphical element at the bottom of this histogram.
h <- l_hist(quakes$depth,
            yshows = "density",
            showBinHandle = TRUE,
            xlabel = "depth",
            title = "Tonga trench earthquakes",
            linkingGroup = "quakes")
Scrolling the mouse to zoom the plot. To pan the plot, press the right mouse button and move the mouse
p <- l_plot(x = quakes$long, y = quakes$lat,
            xlabel = "longitude", ylabel = "latitude",
            linkingGroup = "quakes",
            title = "Tonga trench earthquakes")
Two plots are linked that the change on one change can affect changes on the other.
with(l_scale3D(quakes),
     l_plot3D(long, lat, depth, linkingGroup = "quakes")
)
The plot is splited into three panels by the level of Richter magnitude.
# add a map layer
NZFijiMap <- maps::map("world2", regions = c("New Zealand", "Fiji"), plot = FALSE)
l_layer(p, NZFijiMap,
        label = "New Zealand and Fiji",
        color = "forestgreen",
        index = "end")
# facet `p`
levels <- rep(NA, nrow(quakes))
levels[quakes$mag < 5 & quakes$mag >= 4] <- "Light"
levels[quakes$mag < 6 & quakes$mag >= 5] <- "Moderate"
levels[quakes$mag >= 6] <- "Strong"
l_facet(p, by = levels,
        linkingGroup = "quakes")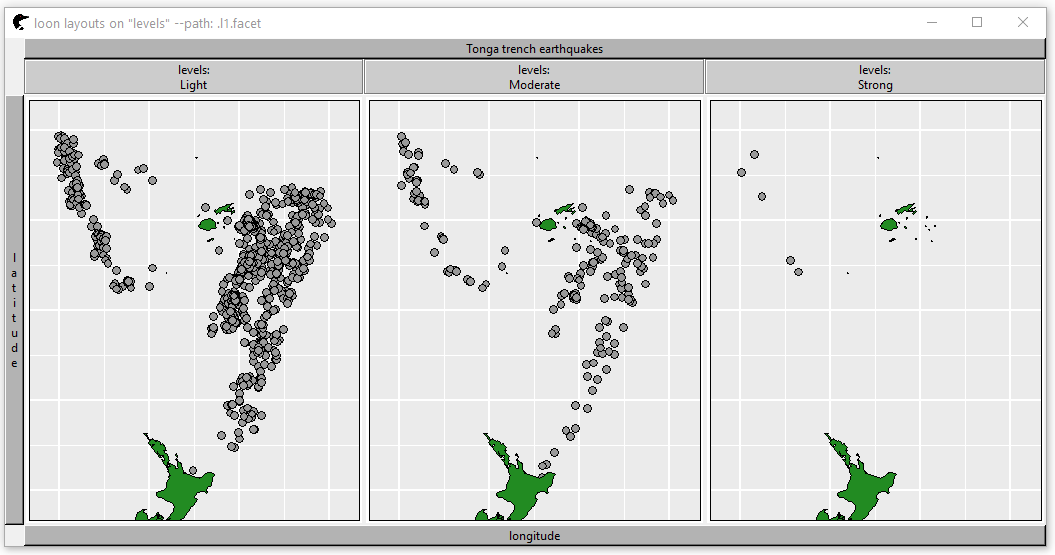
The software is named after a large aquatic bird known as the common loon (Gavia immer) in Canada and the United States, or the great northern diver in the United Kingdom. (Hence the name of the github organization: https://github.com/great-northern-diver)
The loon is a visual predator, diving deep beneath the surface, there chasing its prey with speed and remarkable maneuvrability. Once apprehended, the prey are either swallowed immediately or, when large, at least brought to the surface to be dealt with there.
This seemed an excellent metaphor for an agile, interactive, and exploratory visualization system; one which empowered an analyst to chase, and perhaps discover, whatever features might be revealed in the data by quickly diving below its surface. The goal is to provide such a system in loon.
As an acronym “loon” does not fare so well (least obvious ostensive name) and perhaps its synonym “diver” would be better (direct interactive visual exploration in R). But, then, “loon” is funnier … diveR will be the name of a collection of “loon” related packages.
You can find documentation on some of these related packages via
l_web()
library(loon)
l_web(package = "loon.data", directory = "reference")
l_web(package = "zenplots")     # become one with your data
l_web(package = "ggmulti")      # high dimensional graphics extending the ggplot2 package
l_web(package = "loon.ggplot")  # interactive grammar of graphics via ggplot2 package
l_web(package = "loon.tourr")   # interactive high dimensional tours via tourr package
# And more coming ..
Enjoy!