

![]()
![]()
header_rows parameter no allows you to prevent
column headers from moving to the RTF document header by setting
header_rows to 0.ht[1:5]. The new syntax is
ht[1:5, ].add_columns argument now changed from
a default of TRUE instead of FALSE.If you’ve worked in the pharmaceutical industry as a SAS© programmer doing data analysis for clinical trials, there’s a fair chance that you’ve spent a good amount of time creating RTF outputs. While there are more modern document file formats supported by SAS© and other data analysis languages, RTF remains prolific. Though antiquated, RTF files still remain useful. They support the rich-text format necessary to create documents containing different fonts, colors, and text attributes. Furthermore, RTF documents make it easy for medical writers to insert outputs into different reports and publications as needed. Regardless, outputting data displays to RTF documents is a process embedded in many companies still to this day.
There are many different table packages available in R. For example, stargazer allows you to easily summarize data and create statistical tables in different output formats, such as LaTeX, HTML, ASCII. kableExtra lets you build common complex tables and manipulate table styles in HTML outputs. RStudio has been developing gt which aims to make table creation simple by breaking it into a cohesive set of parts. While there are many more options, few of these support RTF output.
Note: gt plans to support RTF in the future, but this functionality is not yet mature.
One library, huxtable, does support RTF extensively - with a wide array of styling and formatting options. But there are a few important components missing:
It’s understandable that these gaps exist. R has strong usage in academia, and often these tables are created to be printed in text within a paper, for instance rendered using RMarkdown. The tables we create for a clinical trial are typically positioned within their own section of a CSR independently.
pharmaRTF was developed to plug this gap without reinventing the wheel. Huxtable offers a powerful table package that can do virtually any styling necessary for the tables we need to create. pharmaRTF consumes a huxtable table and fills in the missing pieces by offering:
Note: we also plan to support GT tables when the RTF support matures
pharmaRTF is on CRAN! You can install it with:
install.packages("pharmaRTF")You can install the lastest version on GitHub with:
devtools::install_github("https://github.com/atorus-research/pharmaRTF.git")Some of the syntax we use throughout this document uses the
%>% pipe operator. This is to display support for a
tidyverse style of coding. You can find the %>% operator
in the magittr
package.
Before you start worrying about creating an RTF document, you first need to create and style your table. For that, use huxtable:
dat <- iris %>%
  select(Species, everything())

ht <- huxtable::as_hux(dat, add_colnames=TRUE) %>%
  huxtable::set_bold(1, 1:ncol(dat), TRUE) %>%
  huxtable::set_bottom_border(1, 1:ncol(dat), 1) %>%
  huxtable::set_width(1.5)
Now you can create your RTF document. pharmaRTF consists of two different objects:
rtf_doc: the encapsulating objecthf_line: the object used to create titles and
footnotesrtf_doc contains document wide attributes,
including:
hf_line is used to create titles and footnotes, and
contains attributes for each line, including:
There are multiple methods for piecing together an
rtf_doc object. Within this vignette, we will cover the
basics. Let’s assume that you want to keep the default document
attributes, and you’d like to create a single, bold title of “The Iris
Dataset”. You could use the following:
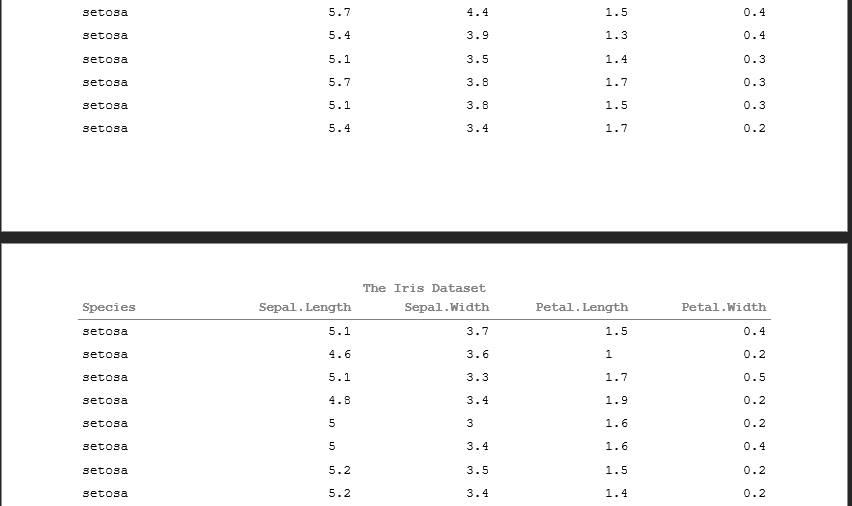
doc <- rtf_doc(ht, titles=list(hf_line("The Iris Dataset", bold=TRUE)))

write_rtf(doc, file="table1.rtf")
The resulting file looks like: 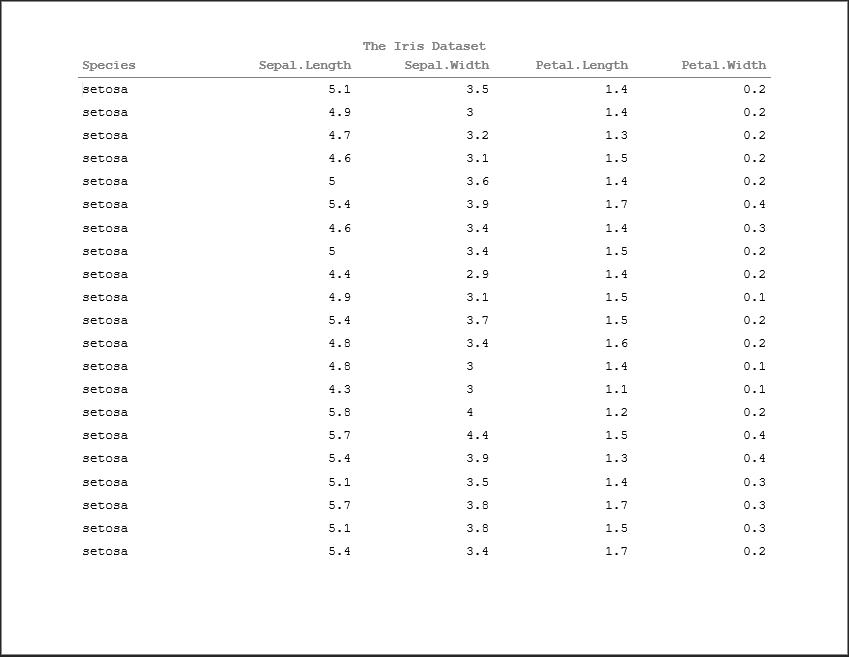
The document opens and presents properly as an RTF document within Microsoft Word. Furthermore, the document paging works properly, with titles and column headers repeating pages to page. Note that the column headers repeat from page to page - this is because pharmaRTF pulls the column headers out of the huxtable table and into the document header.
In the above example, note that we didn’t edit any document settings. By default, pharmaRTF will output RTF files with:
All of these attributes can be changed using property functions. For example:
doc <- rtf_doc(ht, titles=list(hf_line("The Iris Dataset", bold=TRUE))) %>%
  set_pagesize(c(height=5, width=5)) %>%
  set_font('Times New Roman') %>%
  set_margins(c(top=2, bottom=2, left=2, right=2)) %>%
  set_font_size(7)

write_rtf(doc, file="table2.rtf")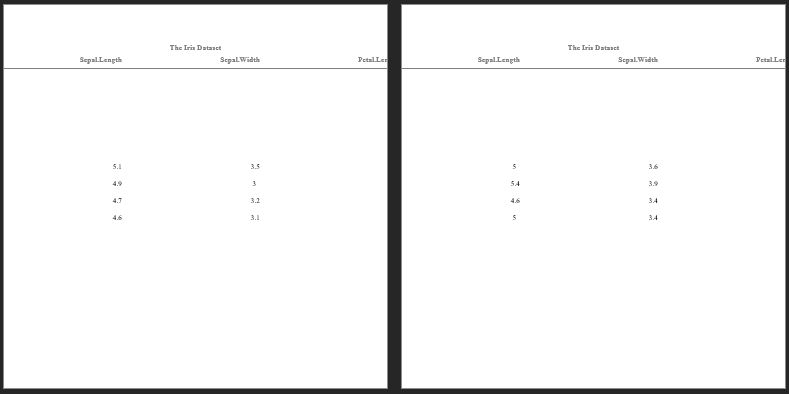
While this display is impractical, it’s possible! And customization to all these attributes may be necessary depending on individual circumstances.
pharmaRTF also offers different interface options depending on your
preference. For example, if you don’t like piping using
%>%, other versions of property functions are available.
Additionally, titles and footnotes can be attached using the
add_titles() and add_footnotes()
functions.
doc <- rtf_doc(ht)
font(doc) <- 'Times New Roman'
font_size(doc) <- 10
doc <- add_titles(doc, hf_line("The Iris Dataset", bold=TRUE))
doc <- add_footnotes(doc, hf_line("Note: This is a footnote!", italic=TRUE, align='left'))

write_rtf(doc, file="table3.rtf")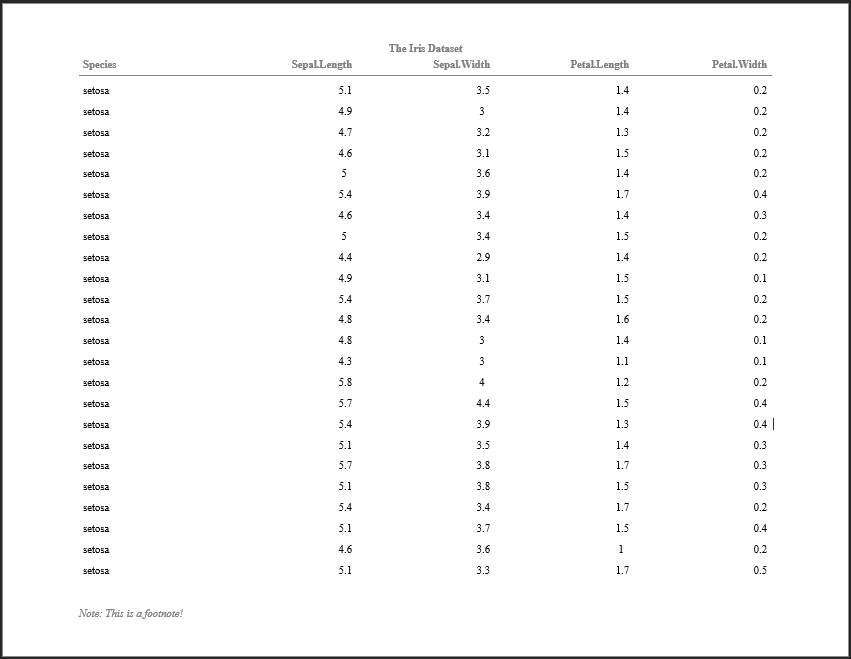
This completes a basic introduction to using pharmaRTF, but there’s still more to learn!
vignette("huxtable_tips")vignette("advanced_usage")vignette("tf_from_file")