


![]()
This R package provides an implementation of the PHATE dimensionality reduction and visualization method.
For a thorough overview of the PHATE visualization method, please see the Nature Biotechnology publication.
For our Python and Matlab implementations, please see KrishnaswamyLab/PHATE.
In order to use PHATE in R, you must also install the Python package.
If python or pip are not installed, you
will need to install them. We recommend Miniconda3 to install Python
and pip together, or otherwise you can install
pip from https://pip.pypa.io/en/stable/installing/.
First install phate in Python by running the following
code from a terminal:
pip install --user phateThen install phateR from CRAN by running the following
code in R:
install.packages("phateR")devtools and reticulateThe development version of PHATE can be installed directly from R
with devtools:
if (!suppressWarnings(require(devtools))) install.packages("devtools")
reticulate::py_install("phate", pip=TRUE)
devtools::install_github("KrishnaswamyLab/phateR")The latest source version of PHATE can be accessed by running the following in a terminal:
git clone --recursive git://github.com/KrishnaswamyLab/PHATE.git
cd PHATE/Python
python setup.py install --user
cd ../phateR
R CMD INSTALL
If the phateR folder is empty, you have may forgotten to
use the --recursive option for git clone. You
can rectify this by running the following in a terminal:
cd PHATE
git submodule init
git submodule update
cd Python
python setup.py install --user
cd ../phateR
R CMD INSTALLIf you have loaded a data matrix data in R (cells on
rows, genes on columns) you can run PHATE as follows:
library(phateR)
data_phate <- phate(data)
phateR accepts R matrices, Matrix sparse matrices,
data.frames, and any other data type that can be converted
to a matrix with the function as.matrix.
This is a basic example running phate on a highly
branched example dataset that is included with the package. You can read
a tutorial on running PHATE on single-cell RNA-seq at http://htmlpreview.github.io/?https://github.com/KrishnaswamyLab/phateR/blob/master/inst/examples/bonemarrow_tutorial.html
or in inst/examples. Running this tutorial from start to
finish should take approximately 3 minutes.
First, let’s load the tree data and examine it with PCA.
library(phateR)
#> Loading required package: Matrix
data(tree.data)
plot(prcomp(tree.data$data)$x, col=tree.data$branches)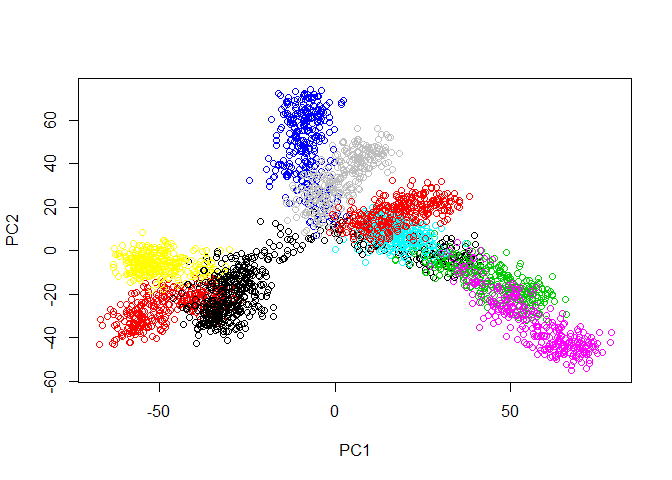
Now we run PHATE on the data. We’ll just go ahead and try with the default parameters.
# runs phate
tree.phate <- phate(tree.data$data)
summary(tree.phate)
#> PHATE embedding
#> k = 5, alpha = 40, t = auto
#> Data: (3000, 100)
#> Embedding: (3000, 2)
Let’s plot the results.
# plot embedding
palette(rainbow(10))
plot(tree.phate, col = tree.data$branches)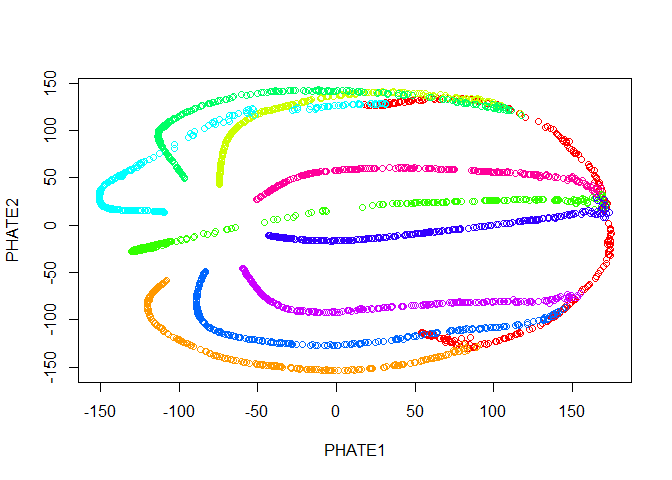
Good news! Our branches separate nicely. However, most of the
interesting activity seems to be concentrated into one region of the
plot - in this case we should try the square root potential instead by
using gamma=0. We can also try increasing t to
make the structure a little clearer - in this case, because synthetic
data in unusually structured, we can use a very large value, like 120,
but in biological data the automatic t selection is
generally very close to ideal. Note here that if we pass our previous
result in with the argument init, we won’t have to
recompute the diffusion operator.
# runs phate with different parameters
tree.phate <- phate(tree.data$data, gamma=0, t=120, init=tree.phate)
# plot embedding
palette(rainbow(10))
plot(tree.phate, col = tree.data$branches)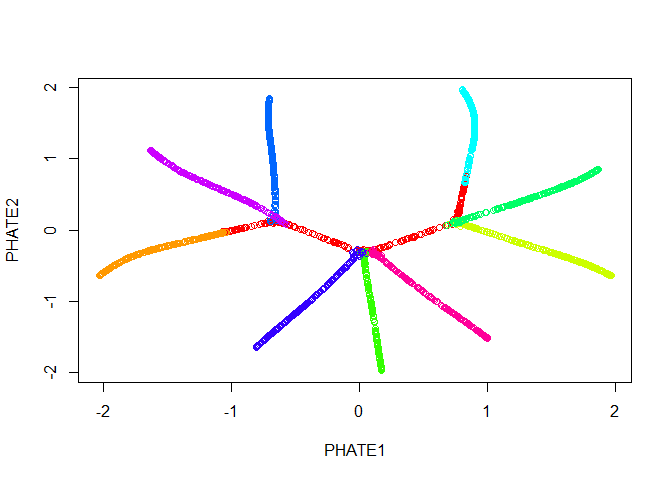
We can also pass the PHATE object directly to ggplot, if
it is installed.
library(ggplot2)
#> Warning: package 'ggplot2' was built under R version 3.5.3
ggplot(tree.phate, aes(x=PHATE1, y=PHATE2, color=tree.data$branches)) +
  geom_point()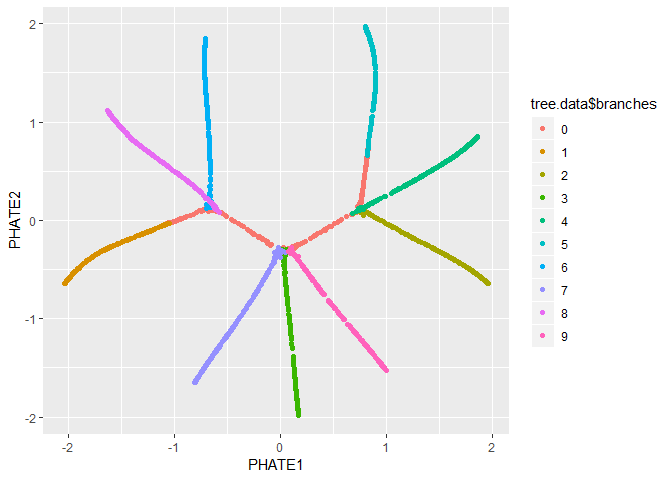
To be consistent with common dimensionality reductions such as PCA
(stats::prcomp) and t-SNE (Rtsne::Rtsne), we
require that cells (observations) be rows and genes (features) be
columns of your input data.
PHATE was removed from Seurat in version 3. You can install a version
of Seurat with RunPHATE included by following the
instructions at https://github.com/satijalab/seurat/pull/1172#issuecomment-564782167.
Check your reticulate::py_discover_config("phate") and
compare it to the version of Python in which you installed PHATE (run
which python and which pip in a terminal.)
Chances are reticulate can’t find the right version of
Python; you can fix this by adding the following line to your
~/.Renviron:
PATH=/path/to/my/python
You can read more about Renviron at https://CRAN.R-project.org/package=startup/vignettes/startup-intro.html.
Please let us know of any issues at the GitHub
repository. If you have any questions or require assistance using
PHATE, please read the documentation at https://CRAN.R-project.org/package=phateR/phateR.pdf or
by running help(phateR::phate) or contact us at https://krishnaswamylab.org/get-help.