This package provides link-based survival models that extend the Royston-Parmar models, a family of flexible parametric models. There are two main classes included in this package:
A. The class stpm2 is an R version of stpm2
in Stata with some extensions, including:
Multiple links (log-log, -probit, -logit);
Left truncation and right censoring (with experimental support for interval censoring);
Relative survival;
Cure models (where we introduce the nsx smoother,
which extends the ns smoother);
Predictions for survival, hazards, survival differences, hazard differences, mean survival, etc;
Functional forms can be represented in regression splines or other parametric forms;
The smoothers for time can use any transformation of time, including no transformation or log(time).
B. Another class pstpm2 is the implementation of the
penalised models and corresponding penalized likelihood estimation
methods. The main aim is to represent another way to deal with
non-proportional hazards and adjust for potential continuous confounders
in functional forms, not limited to proportional hazards and linear
effect forms for all covariates. Functional forms can be represented in
penalized regression splines (all mgcv smoothers ) or other
parametric forms.
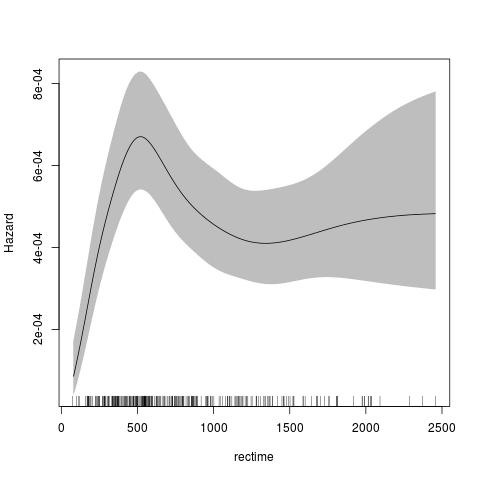
The default for the parametric model is to use the Royston Parmar model, which uses a natural spline for the transformed baseline for log(time) with a log-log link.
require(rstpm2)
data(brcancer)
fit <- stpm2(Surv(rectime,censrec==1)~hormon,data=brcancer,df=3)
plot(fit,newdata=data.frame(hormon=0),type="hazard")
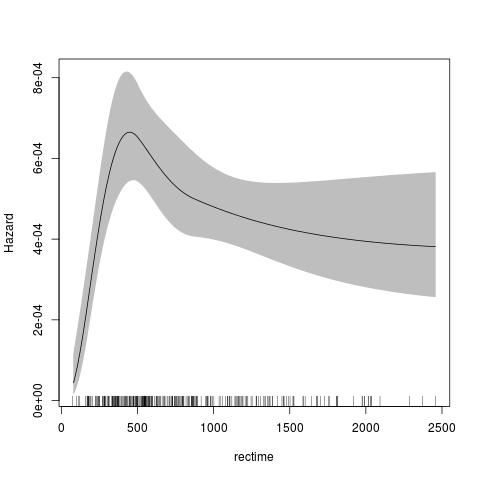
The default for the penalised model is similar, using a thin-plate spline for the transformed baseline for log(time) with a log-log link. The advantage of the penalised model is that there is no need to specify the knots or degrees of freedom for the baseline smoother.
fit <- pstpm2(Surv(rectime,censrec==1)~hormon,data=brcancer)
plot(fit,newdata=data.frame(hormon=0),type="hazard")