
The goal of sarp.snowprofile.alignment is to
Background: Snow profiles describe the vertical (1D) stratigraphy of layered snow with different layer characteristics, such as grain type, hardness, deposition/burial date, and many more. Hence, they represent a data format similar to multi-variate time series containing categorical, ordinal, and numerical data types.
You can install the CRAN release of this package with
install_packages('sarp.snowprofile.alignment') or get the
most recent version from our bitbucket repository with:
devtools::install_bitbucket('sfu-arp/sarp.snowprofile.alignment', ref = 'master')library(sarp.snowprofile.alignment)
#> Loading required package: sarp.snowprofile
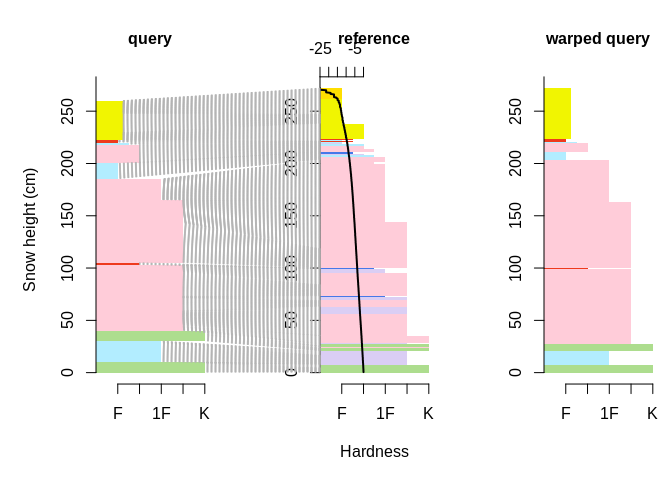
plotSPalignment(SPpairs$A_manual, SPpairs$A_modeled)
The corresponding layers between the two snow profiles
query and reference have been matched, and the
layer thicknesses of the query profile have been adjusted,
so that the warped query is optimally aligned with the
query.
Consider a (very) short list of 5 snow profiles:
setSP <- SPgroup[c(1, 2, 5, 6, 7)]
par(mfrow = c(1, 2))
plot(setSP[[2]], main = "Profile 2")
plot(setSP, SortMethod = 'unsorted', xticklabels = "originalIndices", main = "Set of 5 profiles")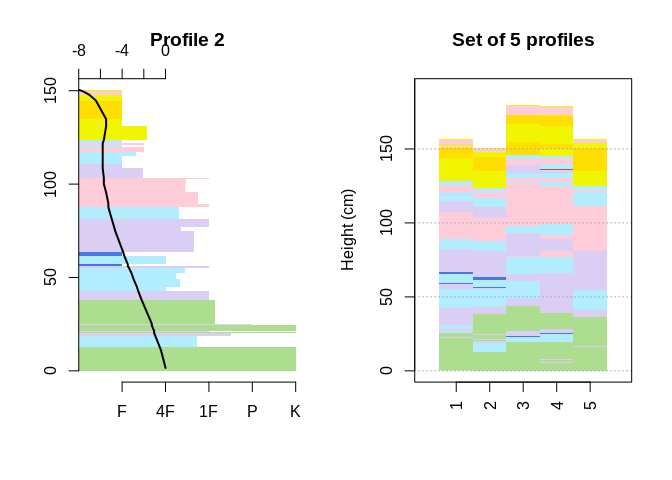
Compute the medoid snow profile that represents the group the best by aligning the profiles and assessing their similarity:
idxMedoid <- medoidSP(setSP)
paste("The most representative (medoid) profile is Profile", idxMedoid)
#> [1] "The most representative (medoid) profile is Profile 2"
The last computation told us the most representative profile from within the group is Profile 2, which we have plotted earlier.
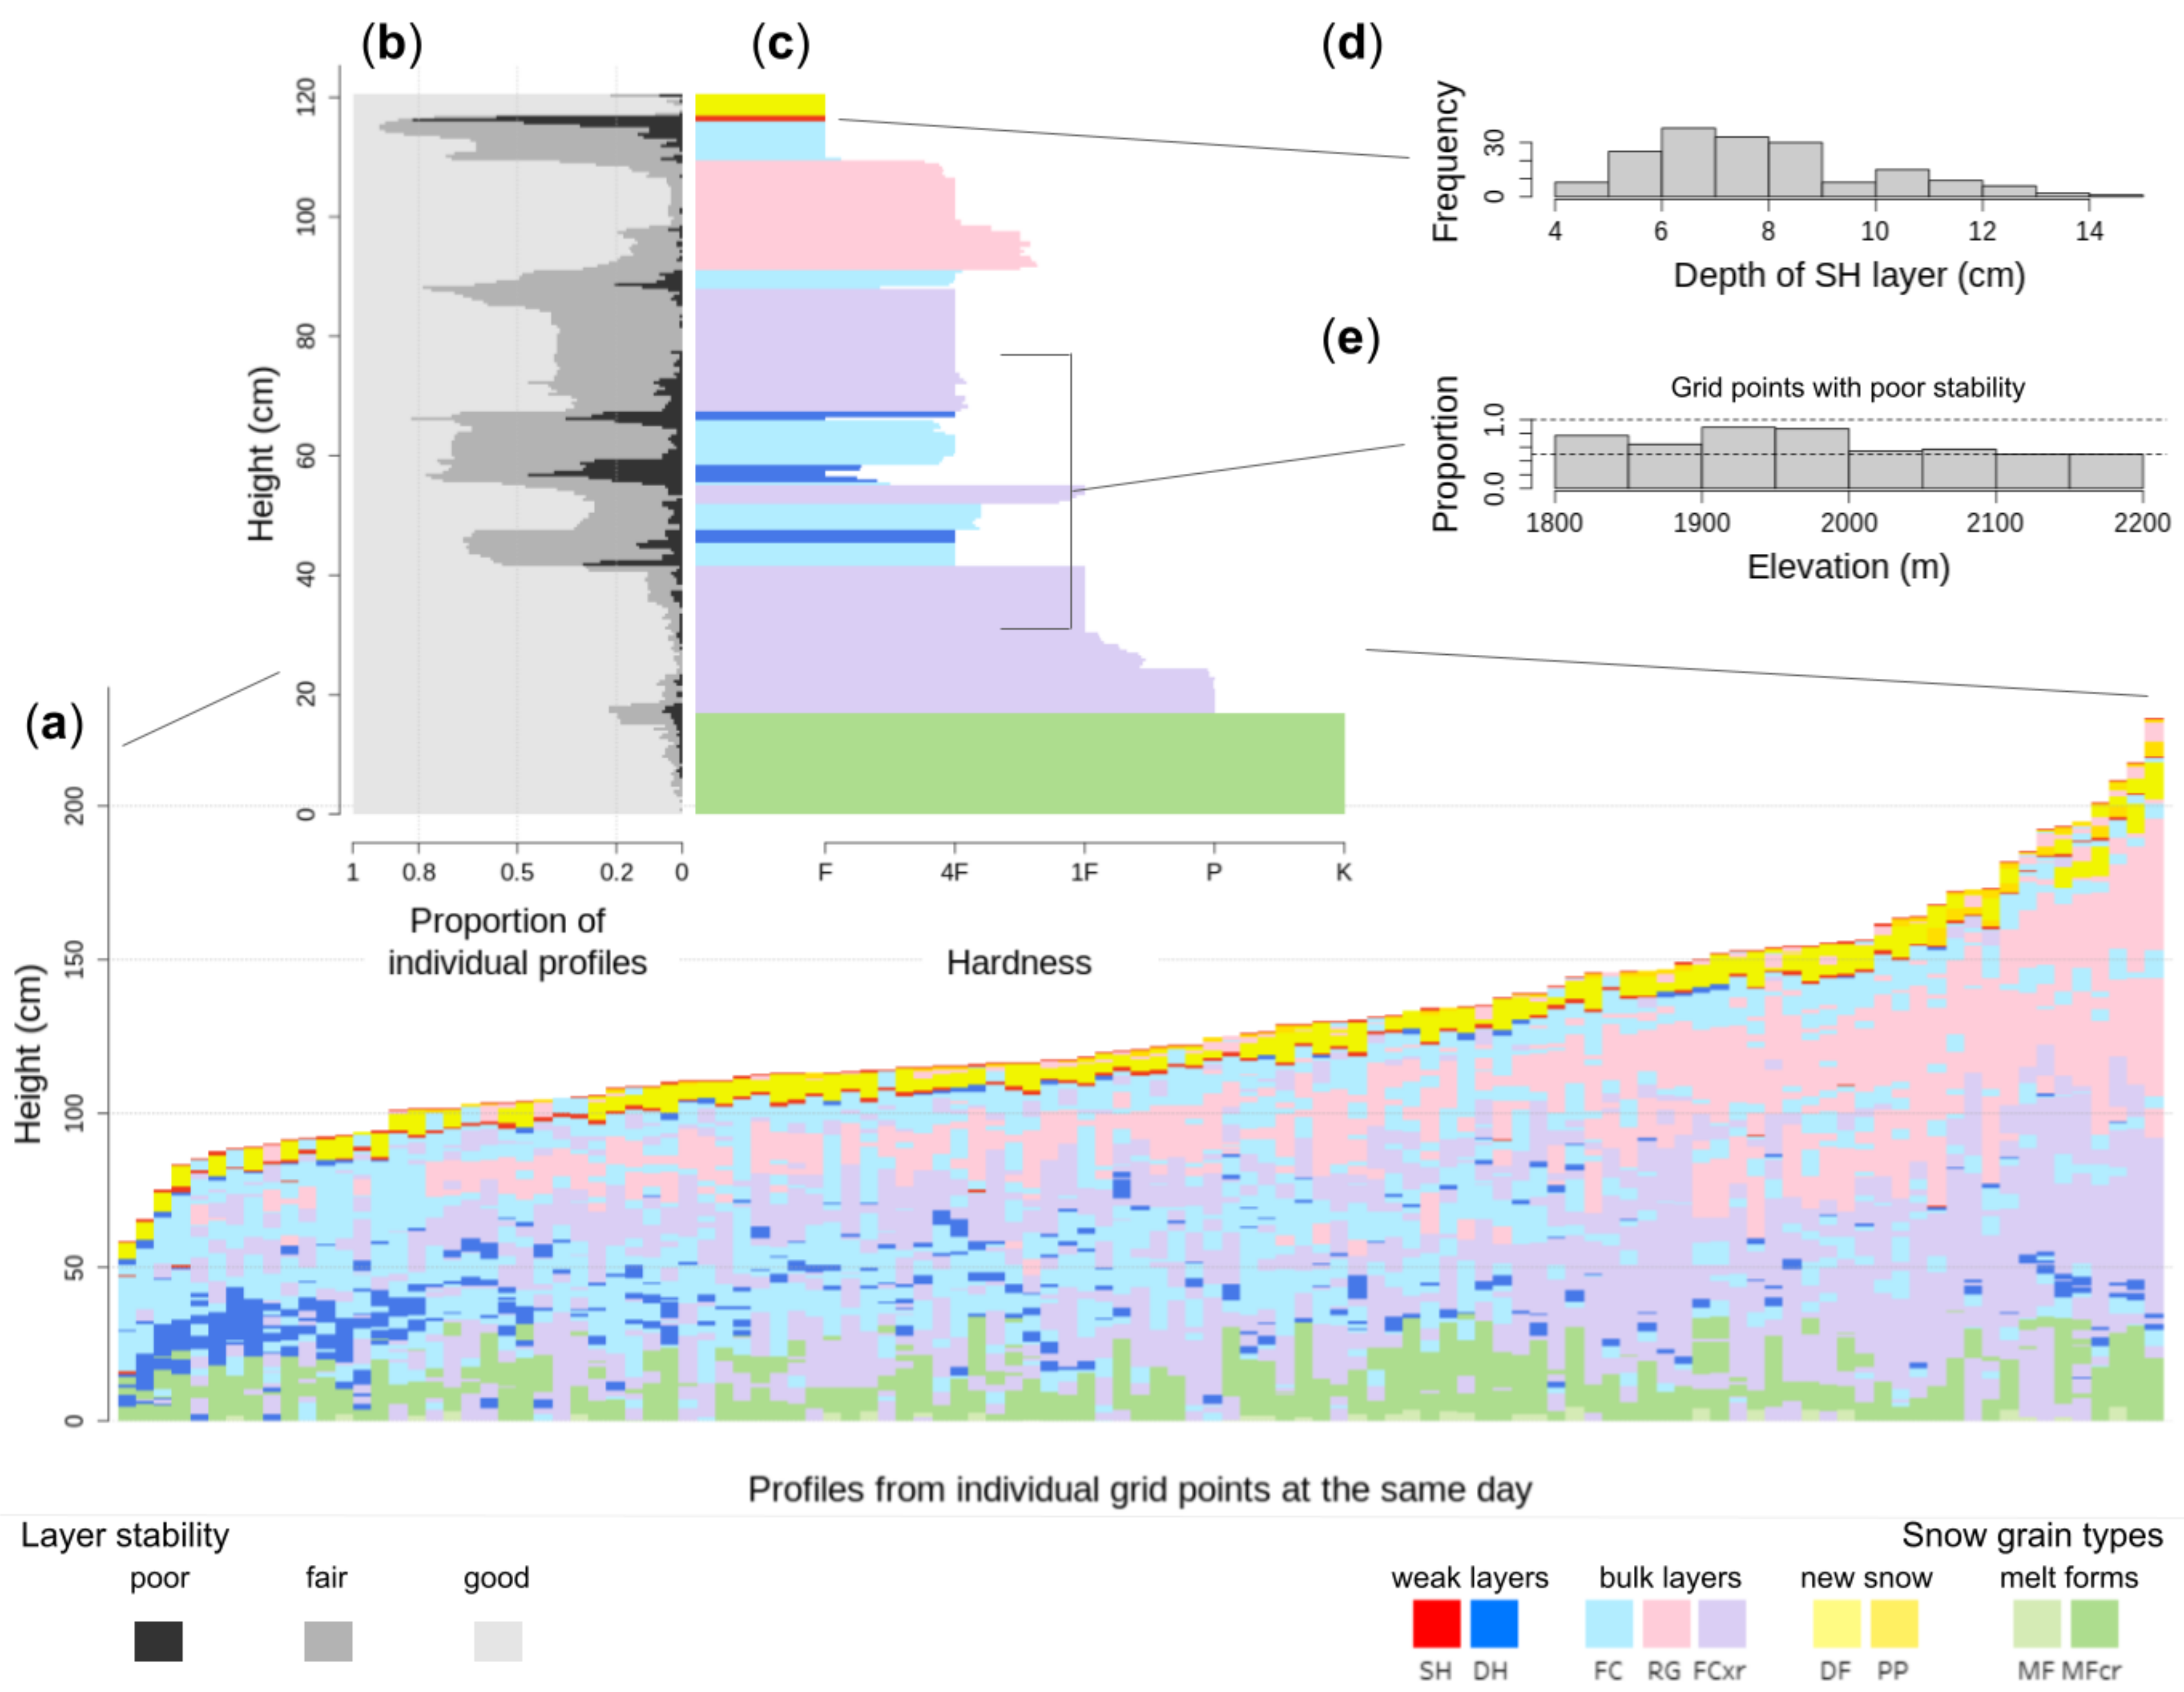
The figure shows (a) a snow profile set from an avalanche forecast region with 112 simulated profiles from the same day, (c) which is summarized by the average profile. The average profile provides access to distributions of layer and profile properties, such as e.g. (b) the distribution of layer stabilities derived from threshold sums, (d) the depth distribution of a SH layer that is starting to get buried, (e) the elevation distribution of the proportion of profiles that contain layers with poor stability in mid snowpack.
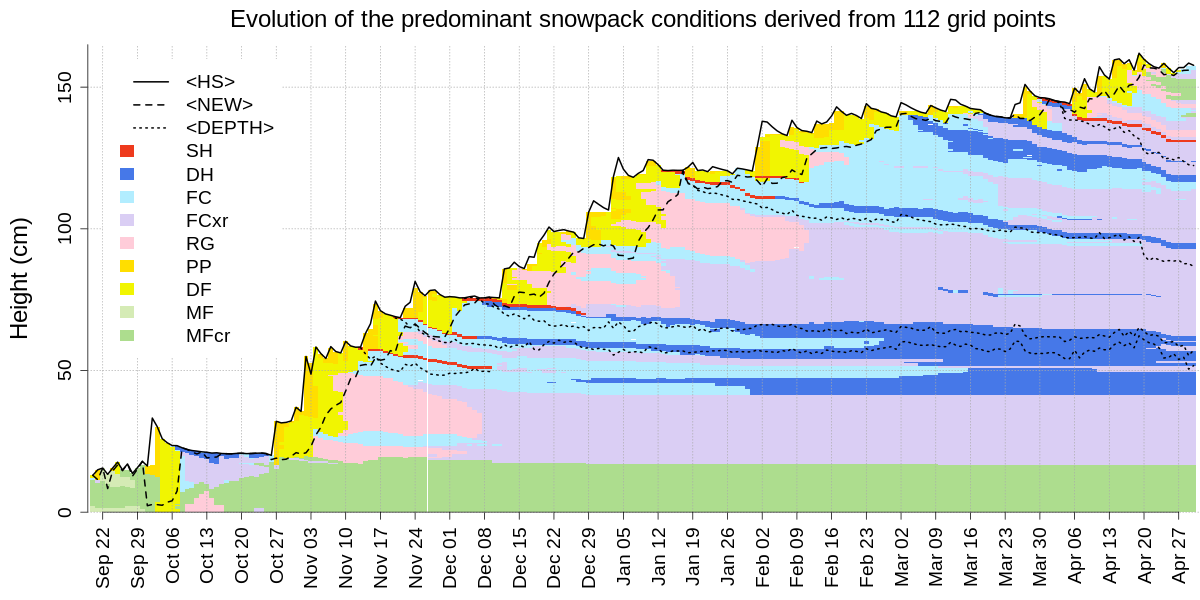
Time series of the average snow profile that illustrates the
space-averaged evolution of the snow stratigraphy (visualized by snow
grain types). The algorithm captures the median total snow height (solid
line,
Check out the functions averageSP,
averageSPalongSeason, and backtrackLayers.
A broader and deeper overview of the package is provided in the
vignettes,
cf. browseVignettes("sarp.snowprofile.alignment")). For a
quick start, see ?sarp.snowprofile.alignment. This package
builds on top of the general package sarp.snowprofile for
data import/export and manipulation,
cf. browseVignettes("sarp.snowprofile")).