![]()
An R package for generating tables of descriptive statistics in HTML.
To install from CRAN:
install.packages("table1")To install the latest development version directly from GitHub:
require(devtools)
devtools::install_github("benjaminrich/table1")An introduction to the package with examples is provided in the vignette.
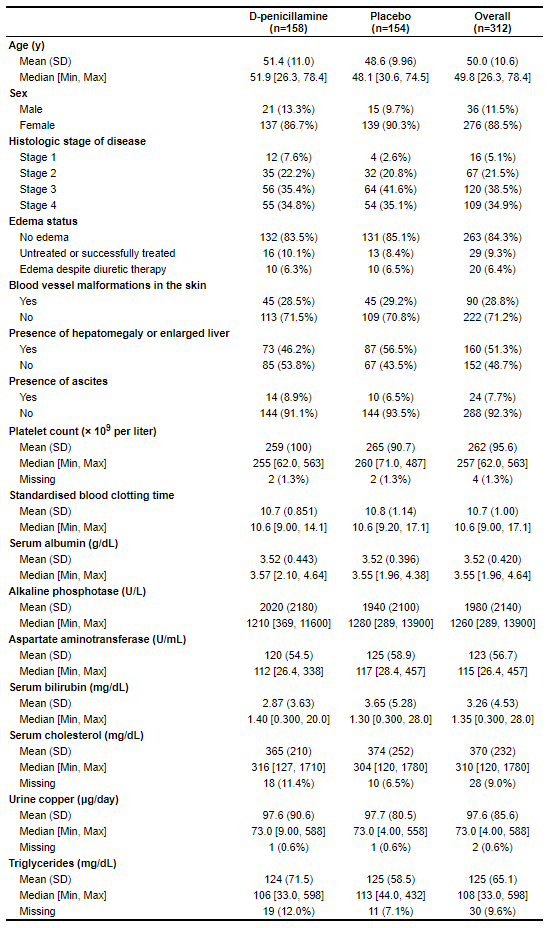
For this example, we will use data from the Mayo Clinic trial in
primary biliary cirrhosis (PBC) of the liver found in the
survival package.
require(table1)
require(survival)
dat <- subset(survival::pbc, !is.na(trt)) # Exclude subjects not randomized
dat$trt <- factor(dat$trt, levels=1:2, labels=c("D-penicillamine", "Placebo"))
dat$sex <- factor(dat$sex, levels=c("m", "f"), labels=c("Male", "Female"))
dat$stage <- factor(dat$stage, levels=1:4, labels=paste("Stage", 1:4))
dat$edema <- factor(dat$edema, levels=c(0, 0.5, 1),
labels=c("No edema",
"Untreated or successfully treated",
"Edema despite diuretic therapy"))
dat$spiders <- as.logical(dat$spiders)
dat$hepato <- as.logical(dat$hepato)
dat$ascites <- as.logical(dat$ascites)
label(dat$age) <- "Age (y)"
label(dat$sex) <- "Sex"
label(dat$stage) <- "Histologic stage of disease"
label(dat$edema) <- "Edema status"
label(dat$spiders) <- "Blood vessel malformations in the skin"
label(dat$hepato) <- "Presence of hepatomegaly or enlarged liver"
label(dat$ascites) <- "Presence of ascites"
label(dat$platelet) <- "Platelet count (× 10<sup>9</sup> per liter)"
label(dat$protime) <- "Standardised blood clotting time"
label(dat$albumin) <- "Serum albumin (g/dL)"
label(dat$alk.phos) <- "Alkaline phosphotase (U/L)"
label(dat$ast) <- "Aspartate aminotransferase (U/mL)"
label(dat$bili) <- "Serum bilirubin (mg/dL)"
label(dat$chol) <- "Serum cholesterol (mg/dL)"
label(dat$copper) <- "Urine copper (μg/day)"
label(dat$trig) <- "Triglycerides (mg/dL)"
table1(~ age + sex + stage + edema + spiders + hepato + ascites +
platelet + protime + albumin + alk.phos + ast + bili + chol +
copper + trig | trt, data=dat)